If you think this market is crazy volatile, then you are right. The market fell into a bear market (down -20%) faster than at any time in history, even including the Great Depression. The daily price moves looked more like an out-of-control roller coaster than a rational, orderly market.
Considering this manic behavior, you have to wonder where are the grown-ups? You also have to ask why investment people making the big bucks can change their minds so quickly and erratically. Where’s the conviction? Disciplined or fickle?
The COVID-19 pandemic has been called a Black Swan-a hard to predict rare event that comes as a complete surprise and has a major effect. It has been characterized as a Known Unknown, and it has been a trigger for the market volatility and downdraft. There have been a number of other factors that combined, however, to cause a “Perfect Storm” of Volatility.
Despite the historically high volatility level, there has not been historically bad investment performance. So far, investment performance has been similar to a typical bear market. It is understood, that investment performance could still get worse.
The graph below shows the incredible volatility starting in March.
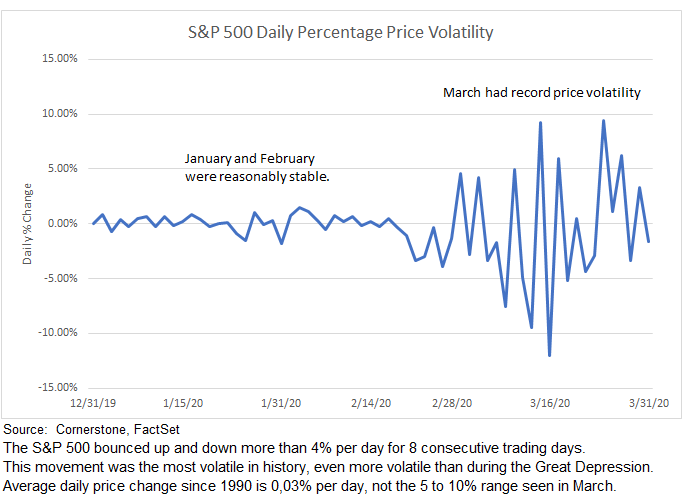
Listed below is the actual S&P 500 index performance. It is down so much because there were more large volatile down days than up days.

VOLATILITY CULPRITS:
Two key contributors to this Perfect Storm of volatility include:
-Human nature, with all the emotional euphoria on the way up and despair on the way down.
-Big, fast computers. Algorithmic Trading, High Frequency Trading, and increasing use of momentum and volatility strategies represent the second major contributor to the volatility. This trading was magnified by excessive financial (debt) leverage.
(Details are listed further below:)
WHAT DOES IT MEAN FOR YOU?
First, it is important to keep perspective. The main priority is saving lives. Everything else comes back.
It shouldn’t impact your Investment Objectives: It is important to maintain a long-term perspective. The huge volatility in March shouldn’t impact a long-term focus. This is not a financial crisis, but rather a crisis of confidence. The depth and duration of the coronavirus are not known, but it does not appear to constitute the fundamental, systemic problems associated with the 2008 Great Financial Crisis. Moreover, the massive government monetary and fiscal support being implemented is much larger and coming much quicker than in 2008.
The sudden -20% market decline has been painful (especially after 11 big years), but the decline is well within the historic range for bear markets. The market decline should also be remembered within the context of the 31.5% gain by the S&P) 500 in 2019. More importantly, the market will come back.
A review of Bull and Bear markets since 1950 shows:
-the average bear market declined -35% and lasted an average of 14 months.
-the average bull market gained 199% and lasted an average of nearly 6 years.
Bear markets are typically much shorter than bull markets, they go down less, and they have always given way to another bull market.
It might sound flippant, but in a way the market had gone too far too fast and was due for some downside.
It is important to remember that there are wide ranges around the average length and return of bull and bear markets. Nevertheless, history shows that all bear markets end.
Portfolio actions that you take (or don’t take) at this point can feel highly uncomfortable but the decisions are not rocket science. Investors have been bailing on investment holdings at a near-record pace and this is no time to be part of the herd’s stampede. There is nothing unique about the list below, but it is supported by ample historical evidence.
-Stay the course. Fear is really the biggest risk.
-Don’t sell unless you have a dire need for cash.
-Rebalance the portfolio to restore beaten-down equity holdings to a weight consistent with your long-term investment objectives.
-If you have cash, then add to equity holdings. This isn’t easy, but a good strategy is to make several smaller investments over time rather than one larger trade.
– At this stage in the bear, there is likely to be far more upside than downside. Remember that investment performance is improved by buying in bear markets, not selling.
It’s Deeper than Fear and Greed — Non-Investment Observations:
It is often said that the markets run on the animal spirits of Fear and Greed. It’s not really that simple. It’s too early to know the depth and duration, but here are some non-investment observations:
-It would be a mistake to bet against the resilience, creativity and persistence of Americans in this time of challenge.
-Health care workers are showing incredible dedicated service despite personal risk and sacrifice and are a true inspiration. This is especially true for the nurses who have the most frontline exposure.
-Essential workers are taking on a new meaning as we see who really is essential.
-Human ingenuity from both the government and the private sector are working furiously and there are good reasons to remain optimistic.
-Many companies are forgoing profits and are keeping employees or paying what they can.
-The general public is showing impressive broad-based acceptance and support for social distancing and quarantines. It has changed lives, but everyone seems to recognize that we are all in this together.
-There are uncounted and often un-noticed acts of helping and compassion that add up to something much bigger.
When considering all this, I am reminded of Genesis 1:27 where it says that we are created in the image of God. It is gratifying to see humanity set aside mundane differences and rise up to face this challenge. These are the times that bring out the best in all of us.
DIGGING DEEPER-VOLATILITY DRIVERS
Human Nature-Complacency and then Panic:
Investors received stellar performance during the longest bull market in history, 11 years, and this was accompanied by the longest economic expansion in history, a stretch that ran for 10.5 years. For years, investment performance ratcheted upward, causing a sense of complacency. Central banks around the globe kept interest rates low, and encouraged investments in riskier assets. Investing was characterized by the Fear Of Missing Out-FOMO. With this benign backdrop it is little wonder that the sudden recognition of the coronavirus was a major factor that upset the apple cart and caused such volatile emotional selling.
Economic prospects-V-Shaped Recovery, or U, or L: Epidemics historically cost lives but have not had big longer-term impacts on markets or the economy. This time it looks different. The speed and suddenness of the global shutdown is unprecedented and economists and others are only gradually beginning to understand the magnitude of this change and then to incorporate this into their models. For example, Goldman Sach’s initial analysis of COVID-19 impact foresaw minimal impact to the U.S. and they saw 1.2% US GDP growth for 2020. A subsequent forecast revised U.S. 2020 economic growth to 0.4%. As of March 21, Goldman has significantly revised their 2020 GDP growth rate down to -3.8%. This forecast includes a -24% annualized negative growth rate for Q2 and then a sharp Q3 recovery of 12% annualized and Q4 gain of 10%. This analysis sees a V-shaped recovery.
The point is not to throw rocks at Goldman Sachs, because they are smart, savvy investors. The point is that analysts are increasingly negative about near-term prospects. Further, it warrants caution regarding how much we really comprehend about the coronavirus impacts. Given the unprecedented nature of the shutdown, it seems that there may be more caution by both consumers and companies as we emerge on the other side and a U-shaped recovery is more likely than a V. Finally, the coronavirus outbreak may prove to be worse than the 9/11 terrorist attacks, but it doesn’t look to be as severe as the full-blown 2008/2009 Great Financial Crisis.
COVID-19 Backdrop: As 2020 began, investors were optimistic the economic expansion would continue, as calming trade tensions between the U.S. and China and three 2019 interest-rate cuts from the Federal Reserve lifted stocks. The coronavirus was widely publicized by mid-January, but it was first ignored and markets went on to post all-time record highs by February 19. For years, it paid to buy each dip in stocks and to embrace trades that bet against the return of volatility. Then the COVID-19 virus became increasingly problematic and ultimately caused an unprecedented global shutdown. Millions of the nation’s businesses suddenly closed their doors, international travel ground to a sudden halt, and personal interactions were sharply curtailed. Markets reacted negatively with unprecedented volatility. As the severity of the situation became increasingly apparent, economic and earnings forecasts were repeatedly revised down lower and lower. The transition from complacency to a sudden, unprecedented global shutdown caused a huge emotional reaction and produced panicked selling.
ALGORITHMIC TRADING:
Algorithmic trading was the other major factor in the huge March volatility. Algorithmic trading essentially involves computer programs that follow defined sets of instructions (algorithms) to do stock trading far faster than humans can do. It often utilizes back-testing of technical indicators like movements of 50-day and 200-day moving averages, trend following patterns and arbitrage opportunities based on pricing anomalies.
Algorithmic trading is different from fundamentally driven trading that is based on rigorous analysis of company valuation and revenue and earnings growth prospects. Instead, “algo” trading looks for relatively small market dislocations and inefficiencies that can be rapidly exploited with strategies related to volatility, momentum and risk parity. Quite simply, it’s not based on strong company earnings growth or an attractive valuation level. Analysts at J.P. Morgan said “fundamental discretionary traders” accounted for only 10% of recent stock trading volume. Goldman Sachs analysis shows equity algorithmic trading is nearly 3 times the level from 15 years ago.
High Frequency Trading-HFT: Algorithmic trading is often based on High Frequency Trading (HFT) that utilizes powerful computers moving in and out of markets at lightning speeds measured in milliseconds. In normal markets HFT adds liquidity and lowers costs by reducing bid-ask spreads on trades. In March, however, profits at the large HFT algorithmic traders were reported to be extremely high, and there is now a question about the value of HFT in times of market duress.
Volatility Trades: The 11-year bull market was accompanied by a below-average level of price volatility. In this environment, hedge funds and other institutional investors utilized a variety of algorithmic strategies to trade on small changes in market volatility, regardless of whether they went up or down. Since price volatility was low, many of these strategies used financial leverage at up to 10X. As markets moved up, low volatility caused traders to buy risky assets. As markets fell, volatility rose and the computers began selling. As a result, during March this computer-based trading magnified both moves upward and downward. In another example, investment strategies were established by market participants to either dampen volatility or enhance returns based on previously reliable relationships between assets. Unfortunately, these pricing relationships fell apart when volatility spiked and caused devastating effects in panicked markets.
Six Sigma: The Wall Street Journal reported prices gyrating by an incredible six standard deviations from the short-term norm. These moves were exacerbated by the presumed low likelihood of extreme market moves with risk models largely based on a period of relative market calm. Since many of these trading strategies were structured with high financial leverage, it became a situation where everyone headed for the exit at the same time. It is easy to see how unwinding these trades caused such panicked selling.
Momentum Trades also benefit from Algorithms: Momentum trading is an investment strategy that has a good historic track record. Momentum traders buy the stocks that are going up the fastest. Or they might buy the stocks that have the greatest revenue or earnings momentum. Regardless, this feeds on itself and the more momentum traders, the more it spirals upward. When markets (or stocks) reverse and head down, then momentum traders are selling the assets that are falling the fastest. They essentially turbocharge the upward buying interest and then magnify the downward selling pressure.
Fundamentals prevail over Algos on a long-term basis: Since Algorithmic trading is focused on short-term factors like volatility and momentum, it has less relevance to fundamental factors. Fundamentals still function to differentiate the merits between various companies and future prospects, and fundamentals still determine the long-term performance of investment assets. What this means to a long-term investor is that algorithms probably reduce trading costs by a small amount during normal market activity, but a disciplined investment process still prevails on a long-term basis.
Liquidity Dried Up:
Liquidity in the financial markets means the ability to sell an investment asset quickly without having to sell it at a big discount. Liquid investment assets usually have a large number of buyers and sellers readily available so that a transaction is easily traded and it minimally impacts the price. US Treasury securities normally have the greatest liquidity. Your house is far less liquid. The sudden shutdown of the U.S. economy was unprecedented and it precipitated an immediate dash for cash.
Dash for Cash: Individuals suddenly faced unemployment or reduced hours, particularly in the airline and entertainment industries. Businesses, seeing markets and revenue shutting down, drew down bank credit lines. Small business owners were particularly vulnerable because they typically lack the financial flexibility of larger firms. Fund managers faced redemptions as investors liquidated holdings. Traders attempted to unwind trades that had worked in a low volatility investment environment. In many of these cases, normal cash flow patterns were disrupted and caused an immediate need for cash.
US Treasuries & Gold-Traditional Safe Havens Didn’t Work:
US Treasuries prices typically rise (and yields drop) when investors seek a safe haven. This time, Treasurys dropped the at the same time stock prices were dropping, so there was no safety anywhere.
The Treasury market was disrupted by other factors as well. For example, even short maturity Treasury securities (due in 30 days or less), sold off because people wanted cash, NOW!
Gold is another asset the investors buy in scary times, but gold actually declined at the same time that the stock market began falling.
Risky Assets were Crushed:
With fears of an imminent recession, investors fled riskier debt, afraid companies that loaded up on credit amid low interest rates would have trouble repaying. These assets became extremely illiquid, and the only way to unload them was to sell at a huge discount. As an example, the high yield (junk bond) Exchange Traded Fund- HYG quickly fell 15%. Somewhat ironically, investment managers during times like this are typically forced to sell their highest-quality assets because the discounts on lower quality assets are so extreme.
Short Covering:
Short covering is often the cause of markets spiking upwards. A short trader essentially uses a derivative security to sell an investment asset today with the provision to buy it later before a specified date. For example, a short trader hopes to sell a stock today for $100, and buy it in the future at $90, a lower price. This can be extremely risky, but it can be lucrative. When the market is going up instead of down, this trade becomes increasingly unprofitable. You have already sold at $100, and now you have to buy at perhaps $110 or more. As the market goes up, short traders have to sell (Cover) before they lose even more money. A large number of short sellers covering (closing out their increasingly unprofitable trade), means prices go up even higher. This was a part of the reason that the S&P 500 went up 9.4% on March 24. Many times, large upward price moves are caused by short covering.
Margin Calls:
Investors are allowed to borrow money in their brokerage accounts to buy even more stock. This works great in rising markets, and it made you feel like a rock star in 2019 when the S&P 500 went up 31.5%.
When stocks decline, investors are required to put in more collateral. They need to add to their margin account. When they don’t have the cash, their broker will liquidate some of their securities to re-establish their required margin. This is a “Margin call”. Obviously, the more selling pressure in the market place, the greater the number of margin calls and this results in a negative downward spiral. Margin calls were a major negative factor in the 1929 stock market crash.
Final Comments:
These Cornerstone blog posts are designed to provide education and a long-term perspective related to investments. The commentary relies on my career experience, credible sources and hard data as much as possible. Even so, there are always many surprises and unexpected outcomes and this certainly applies to the comments listed above. As always, your feedback is helpful and beneficial.
Jeff Johnson, CFA
April 1, 2020
