What a difference a year makes. By Christmas Eve 2018, markets were filled with despair at the prospect of a global recession, and the S&P 500 plunged nearly 20%. Since the panic selling at the end of 2018, markets generated stellar 2019 gains, led by a 31.5% total return for the U.S. S&P 500 index. At this time the market narrative is giddy and euphoric based on fading fears of a global recession, less concern of a trade war and more accommodative central banks.
WHAT A BULL-WHAT A YEAR!

Not Interested in All the Details? See 2020 Outlook & Recommendations
2019 WAS UNIQUE IN MANY WAYS:
-The year started in the midst of a 35-day U.S. government shutdown that ended January 25, providing a negative backdrop to start the year. Economic forecasts were downgraded, but this was soon forgotten (markets often have a short attention span) as the government resumed operations.
-The economy generated the lowest unemployment rate at 3.5% since December 1969, 50 years ago when Richard Nixon was President.
-Inflation remained below the Federal Reserve’s 2% target.
-Ongoing recession fears were stoked in late summer by an “Inverted Yield Curve” and then ignored and forgotten. An Inverted Yield Curve is a phenomenon where long-term government interest rates are lower than shorter maturities. This situation infers that longer maturities are low because investors are pessimistic on a longer-term basis, and it is typically a precursor to a recession. Solid consumer spending negated this indicator, however, and markets continued upward.
-The year closed out by continuing the longest economic expansion on record.
-This was the only decade on record without an economic recession.
-Although consumer spending remained robust, manufacturing and capital spending remained weak.
-The year continued the longest bull market on record.
-For 2019, all major asset classes produced above-average returns. This has never happened before according to Schwab.
SECTORS:
Biggest Winners: The broad-based technology sector gained 47.9%, and the semi-conductor sub-sector was up 60.0%. Big stock gainers included Apple up 85% and Microsoft up 55%.
Laggards: Energy was the weakest sector, up only 4.7%. The Exploration & Production sub-sector was particularly weak with a decline of -10.6%. Continuing low oil prices negatively impacted drilling revenues, particularly for the “fracking” drilling companies.
IPOs:
Although the overall market did exceptionally well, some highly anticipated Initial Public Offerings-IPOs were disappointments.
–Lyft-LYFT went public in March at $72 and ended the year at $43.02, down -40%.
–Uber-UBER debuted in May at $45 and closed down -34% to $29.74.
–Beyond Meat-BYND made headlines with their IPO that priced at $25 in April, it soared to $225 by July and then settled at $75.60 by yearend. Nevertheless, it was up over 200% from its IPO.
-Other notable disappointments included Pinterest and Peloton. Most of the year’s large technology listings traded below their opening prices.
U.S. SMALL CAPS:
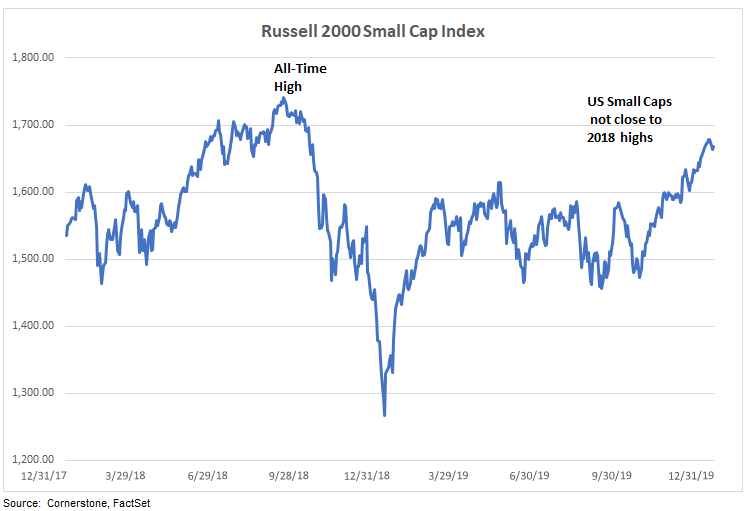 US small capitalization stocks have trailed US big caps in the recent past, but the Russell 2000 Small Cap Index still advanced a very respectable 25.5% for 2019. Although small caps have trailed large caps in recent years, small caps still have higher performance over the time of their long-term history.
FOREIGN DEVELOPED:
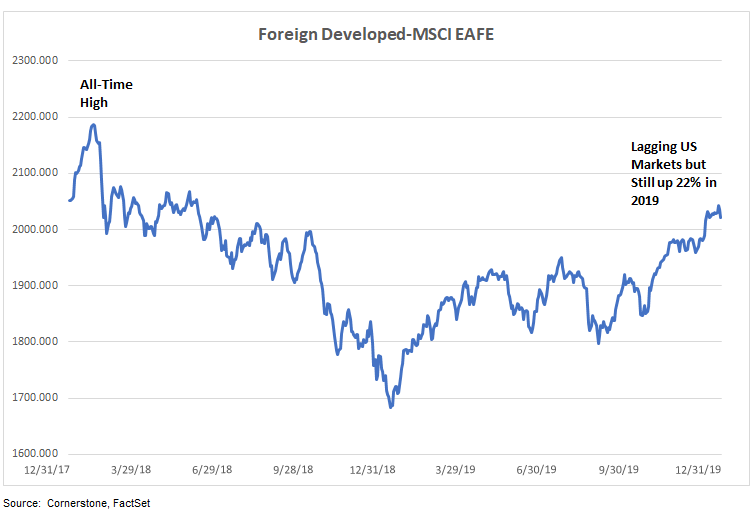
Foreign developed markets stocks hit their all-time-high of 2,186.65 on January 25, 2018, well in advance of record high levels for the U.S. stock market. Although foreign stocks trailed U.S. stocks, gains were still respectable at 22% for the broad developed market MSCI EAFE index. The European STOXX 600 index was up 23.2% and the Japanese Nikkei 225 index was up 18.2%.
EMERGING MARKETS:

Emerging markets were big winners in 2017 and the MSCI Emerging Markets index peaked at 1,273.07 on January 26, 2018. Emerging markets have trailed other markets more recently but finished 2019 up 18%. Part of the reason for the weaker emerging markets performance is that China is experiencing the slowest economic growth since they began reporting quarterly GDP in 1992. Nevertheless, the mainland Shanghai stock exchange gained 22.3% in 2019. Despite Hong Kong’s political struggles with China, the Hang Seng index still managed a 9.1% gain. Other emerging market notables: Brazil was up 31.6%, Mexico was up only 4.6%, and South Africa registered a -2.8% decline.
INTEREST RATES:
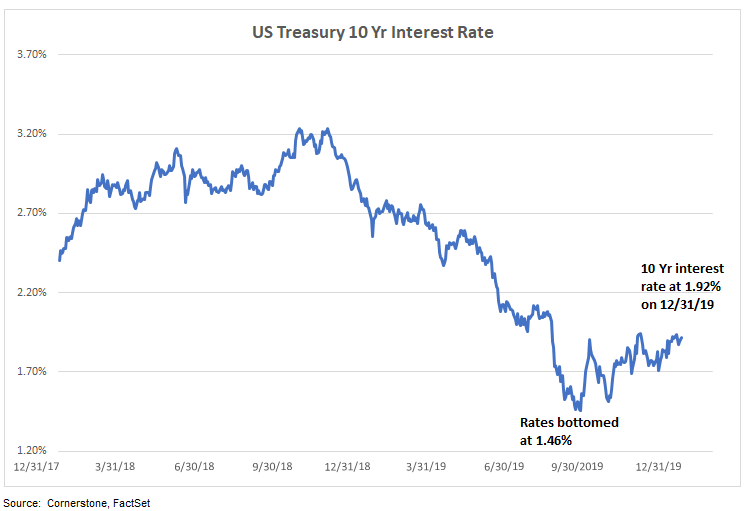
Interest rates continue to confound both investors and economists. At the beginning of 2019 there was a broad consensus that rates would trend modestly upwards. Instead, interest rates on the 10-year U.S. Treasury bond moved from 2.66% in January to 1.46% by September 4th. Rates rebounded somewhat to 1.92% by yearend, but a sharp upward spike above current levels does not look imminent. It may sound trite, but the phrase “Lower for Longer” has been an apt descriptor and it warrants consideration for the upcoming year.
THE LAST30 YEARS-VOLATILE BUT GOOD:
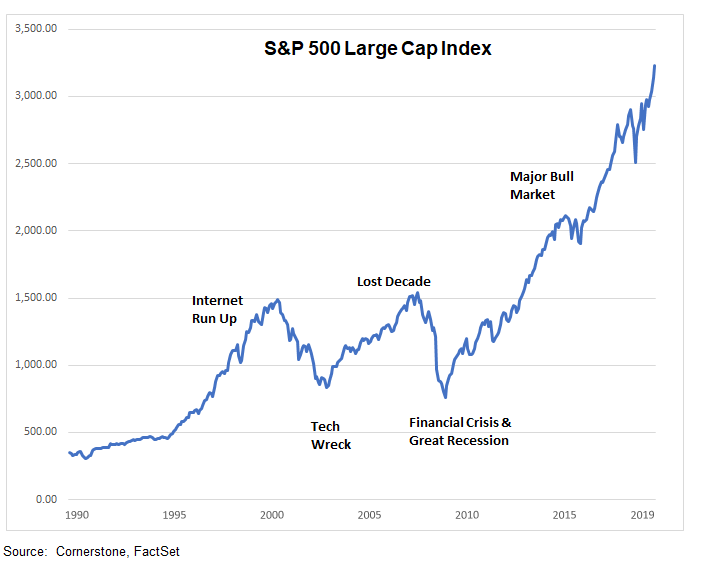
The Last 30 Years: Much perspective can be gained from taking a longer-term perspective. The last 30 years have been highly volatile but very good on a longer-term basis.
The Decade of the 1990s began with the emergence of the internet and culminated with the dot com mania. By the end of the decade there was also the Y2K hysteria related to computer programs not being programmed to handle the transition for dates changing from 1900s to the 2000s (too many software programs supposedly lacked the first two digits of the year.) Despite alarmist predictions, electric utilities did not encounter shut-downs and planes did not fall from the sky. In the end, the real winners were the doom and gloom consultants who benefitted from a once-in-a-century opportunity to charge high fees.
The Decade of the 2000s: While our computer systems handled the transition to the new millennium, we learned belatedly that our internet and “New Economy” fascination was unrealistically optimistic. Consequently, we suffered a new millennium hangover and an inevitable Tech Wreck.
-The tech-heavy Nasdaq Composite index declined 78% from the March 10th 2000 peak to the October 9th bottom.
-The decade of the 2000s not only suffered from the tech debacle at the beginning of the decade, but also the financial crisis and the Great Recession at the end of the decade.
-The combination of these two downdrafts resulted in the S&P 500 generating a total return of a negative -0.95% for the entire decade.
-Ultimately the decade, known as the “aughts”, came to be characterized as the “Lost Decade.”
The Decade of the 2010s: After the tech and financial crises of the 2000s, the 2010s followed with a spectacular recovery.
-the decade closed out with the longest economic expansion on record (and still counting.) It should be noted, however, the current recovery at a 2.3% annualized growth rate is the slowest of all recoveries since 1950. The average recovery growth rate since 1950 is 4.1%.
-This was the only decade on record without an economic recession.
-The 2010s also included the longest bull market on record and it is still going strong at year-end 2019. In fact, 2018 was only negative year for the S&P 500 index. The total return (including dividends) for the S&P 500 since the beginning of the bull market is 490%.
INVESTMENT PERFORMANCE:
The previous section provided a graph and high-level comments. This section provides a table format and additional comments.
Table Below:
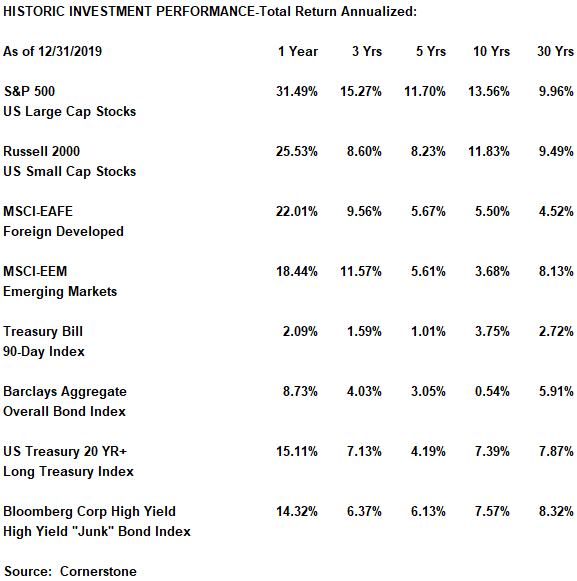
Long-Term Equity Performance: Equity performance was strong but an examination of historic performance shows the importance of diversification. Asset classes have experienced long stretches of both outperformance and underperformance. It is important to avoid making investment decisions based solely on recent performance.
U.S. stocks have been the strongest performers over the last 30 years. Although data is not listed above, foreign developed stocks outperformed US large company stocks in the decades of the 70s and 80s.
Emerging markets outperformed in the 90s and 00s but significantly underperformed in the 2010s.
Long Bonds WERE Great But: The U.S. Treasury 20 Yr + Index is a long-maturity treasury index that is very sensitive to changing interest rates. Historic performance has been strong because rates have declined to historically low levels and this forced bond prices to move up. (This is the inverse relationship between interest rates and bond prices. Although interest payments are fixed for the life of the bond, declining interest rates cause bond prices to rise.) If interest rates move up to more normal levels, then bond prices will go down and the total return will be very negative. (In the case of rising interest rates, bond prices go down.) For example, if you hold a 10 year bond that pays 2% interest and then interest rates rise to 3%, then you would have to reduce the price of your previously purchased 2% interest bond to a low enough bond price so that the interest earned would match the current market-determined 3% level.
Junk Bonds: The Bloomberg High Yield “Junk” Bond Index is very sensitive to the economy and defaults in a recession. Consequently, this asset class performs well during economic expansions, but it underperforms heading into recessions.
2020 OUTLOOK & RECOMMENDATIONS:
Outlook Rationale:
Lessons to be Learned: There are many lessons from both the recent past and also on a longer-term basis that impact the 2020 Outlook.
First, it is highly unlikely that 2020 performance will match the extraordinary 2019 gains.
-Although the U.S. SP500 large cap index WAS the place to be in 2019, it is unlikely to repeat this stellar performance.
-Remember, historic performance is not a good predictor of next year’s performance.
Market Fundamentals:
It is important to remember that market fundamentals are modestly positive, and don’t appear to be in bubble territory.
-Corporate earnings are a key driver of stock market gains. Although 2019 earnings growth was slightly negative, earnings were up 22% in 2018. More importantly, corporate earnings are projected to increase 9.6% for 2020 according to FactSet.
-Valuation is another consideration related to stock market performance. Although the current trailing 12-month Price/Earnings ratio is relatively high at 20 times, it is less over-valued when looking at P/E ratios during periods of low inflation.
-The Price/Earnings ratio is certainly not as extreme as in 1999 when the “New Economy” mindset was the vogue. The trailing PE in 1999 was 30X compared to 20X today.
-Earnings growth over the last ten years has actually accounted for two-thirds of annualized S&P 500 total return while multiple expansion due to rising P/E ratios accounted for one-third according to BCA Research and the Wall Street Journal. The current consensus forward Price/Earnings ratio for the S&P 500 is a more reasonable 18X compared to the higher trailing 20X P/E. As long as earnings growth stays strong, there is more support for equity markets.
-Higher Price/Earnings ratios are not a good predictor of shorter-term investment performance, but they do help predict future longer-term investment returns. What this means is that current above-average valuation levels may not cause weak short-term investment performance, but these higher valuation levels are likely to cause below-average future long-term performance. As a result, current higher valuation levels do not indicate an imminent market decline, but they do indicate that future long-term returns are likely to be lower than the historic 10% return level.
-Don’t assume that the big 2019 gains will lead to 2020 losses. Analysis by Mark Hulbert, a Market Watch columnist, shows that when the Dow Jones gains over 20%, in a year, there is a a 65% chance that the next year will also be positive. In other words, the market is highly efficient and making investment decisions on a single factor is generally counterproductive.
Wall Street Expectations:
Although institutional investors have a spotty track record in predicting future short-term market moves, the rationale for their predictions is useful. Based on positive fundamental consensus expectations, Wall Street money managers expect modest 2020 gains. According to the December 2019 Barron’s portfolio manager tally, the S&P 500 is expected finish yearend 2020 at 3,300, up 2.1% from the 2019 year-end close of 3,230.78. Similarly, the CNBC Market Strategist Survey shows the S&P 500 ending 2020 at 3,330.
Reasons to track these big money investors include:
– They do good fundamental analysis and their consensus forecasts provide a reasonable baseline.
– It is not wise to categorically ignore the consensus forecasts. No one is able to consistently predict short-term market moves, but the consensus forecasts indicate what is priced into the market and what might happen as market conditions change.
-It is important to remember that their investment horizon is typically much shorter, and individual investors have the benefit of being able to take a longer-term perspective.
-The FactSet consensus of money managers for the S&P 500 index shows 9.6% earnings growth for 2020. If corporate earnings are reasonably close to this 9.6% level, then this provides significant market support.
Although these forecasts and outlooks have merit in a base-case scenario, there are reasons for caution. Unexpected negative surprises happen and can cause significant short-term negative performance. As a result, it is critical to stick with long-term objectives.
Recommendations for 2020:
–Stay diversified. Don’t be tempted to overweight your big winners. It is certainly not the time to overweight yesterday’s winners.
–Rebalance your portfolio-Your big cap portfolio exposure is likely overweight due to relatively strong performance and should be trimmed. Funds taken from your large cap holdings could be rebalanced into US small cap, foreign developed and emerging markets. Investors who rebalanced by trimming their technology holdings in the late 1990s had far better performance than those who blindly rode over the tech wreck cliff.
–Don’t try to time the market and make big swings in portfolio weights. Selling everything and
“going to cash” is not a prudent strategy and neither is “going all in” by abandoning your long-term objectives. Don’t over-react to either the bullish polyannas or the doom and gloom Perma-Bear crowd.
–Tactical adjustments. Large market timing bets that take your portfolio asset allocation away from your long-term Investment Objectives needs to be avoided. However, smaller incremental tactical adjustments could be considered. For example, you could modestly underweight the overall equity weight, and modestly overweight the cash holdings weight.
-Recognize that volatility and bear markets (down over 20%) are a part of investing. There have been18 bear markets since 1950, and they have all ended with subsequent bull markets. Although they occur on average roughly every four years, they are notoriously difficult to predict (and profit from.) Since returns are often greatest leading up to a bear market and they are also very strong shortly after a bear market, a market timing strategy might easily miss these periods of significant gains. Remember, time in the market is more important than timing the market.
-Avoid longer-maturity bonds. Although longer maturity interest rates are not expected to spike upward, the longer maturity bonds are extremely volatile. For example, the US Treasury 20-year bond had a total return of 23.4% from the beginning of 2019 through August 31 as interest rates dropped. Since that time, interest rates have trended upward modestly and that index lost over 8% from September through December. As a result, the 23% gain through August was reduced to 15.1% by yearend. A helpful rule of thumb to project future long-term bond returns is to take the current bond yield as an indication of the future annualized performance. For example, the current 10-year U.S. Treasury note has a yield of 1.92%, and this implies that you might expect a return of not quite 2% a year for the next ten years. This would not likely be a good investment. With the 30-year US Treasury bond trading at 2.3%, a return of 2.3% for 30 years would even worse!
To summarize, don’t react to isolated factors, but rather take a broad-based long-term perspective related to investments. History going back to the 1930s shows a 6.5% S&P 500 earnings growth rate through a wide range of economic and market conditions, and earnings growth is a key driver of market performance. This 6.5% expected return is less than the long-term historic average of 10%, but it takes into consideration the current relatively high valuation levels. In addition, this level is supported by numerous successful long-term investors. Finally, a 6.5% long-term expected return makes sense for reasons of conservatism. An investor is better off planning for a lower return and then being wrong because the market did a little better. Having a return expectation that is too high and then coming up short is a much worse outcome. A diversified portfolio, a long-term perspective and a 6.5% equity return expectation should provide be a reasonable investment approach. For bonds, current low interest rates mean that a 3% expected long-term return makes sense. Combining long-term expected returns for a typical 60% equity/40% bond portfolio comes to a 5.1% return on an overall portfolio.
As always, there are no sure things in the investment world, but hopefully this content provides helpful perspective.
Jeff Johnson, CFA
January 9, 2020
