Overview-Slamming on the Brakes:
There was nowhere to hide in 2022 as a diversified 60/40 portfolio had the worst performance since 1937. Nearly all major asset classes declined sharply. Stocks had their lowest returns since the Great Financial Crisis of 2008 and the 40-year bond bull market came to an end with the worst bond performance ever. The reason for the bloodbath is that the era of easy, low-cost money came to an abrupt end. The pivot from free/easy money (from late 2008 through late 2021) towards more normalized interest rates meant that asset price inflation was displaced by consumer price inflation.
As the Fed belatedly recognized the error of the “transitory” inflation narrative, they raised short-term interest rates by 4.25% during the course of 2022-the fastest pace since the Volcker era some 40 years ago. The easy money era was caused by two crises: The Great Financial Crisis starting in 2008, and the COVID-19 pandemic starting in early 2020. Central banks around the world reacted to these crises by pushing interest rates to near zero (and even negative rates in Europe and Japan.) There is little doubt that global coordinated policy responses to the GFC and the pandemic were essential, but hindsight tells us that the response was not sufficiently targeted and it caused serious economic dislocations. The stimulus over this long 13-year period provided more money than the productive capacity of economy was able to efficiently absorb. It also encouraged investors to bid up valuation levels and take greater risks to pursue higher returns than what was available from shorter, safer U.S. Treasury bills. The reality for investors is that strategies that worked from 2009 through 2021 (Fear Of Missing Out-FOMO, There Is No Alternative-TINA and Buy the Dip) no longer worked in 2022. Hopefully, the current policy to normalize interest rates can be accomplished in a shorter time frame, and without severe economic consequences.
Long-Term Performance and Risk:
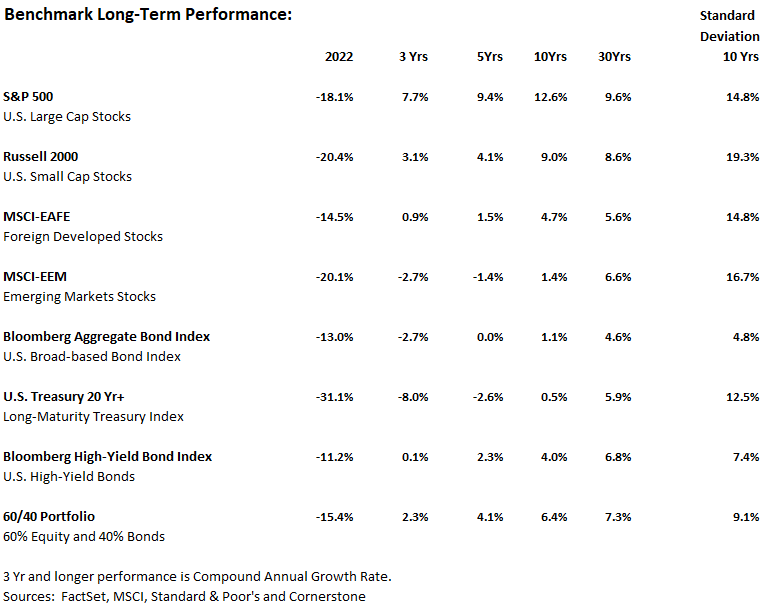
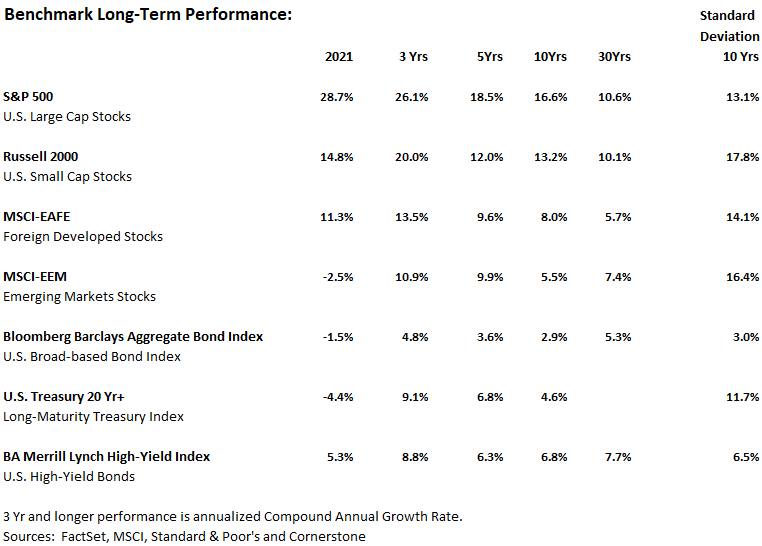
The data shown in the table above provides context and perspective related to performance and risk (standard deviation) for both the short-term 2022 performance and longer-term performance.
Some of the Major Take-Aways:
-Bonds, especially long maturity bonds, were crushed and did not provide the historic hedge to offset against equity declines. Bonds typically hold their value or even provide positive performance when stocks decline.
-Since bonds did not provide the typical ballast to negative stock performance, a typical 60/40 portfolio declined more than -15%.
-U.S. large cap stocks suffered a sharp decline after a decade of outperformance.
-Huge tax loss selling and a rebalancing by pension and sovereign funds moving funds from equities to bonds also contributed to the declines.
As always, recent performance is a poor forecast for the future, and negative 2022 performance is no reason to avoid bonds or stocks in the future.
WINNERS:
Although most assets, sectors and stocks declined, there were some winners:
Energy was the only positive sector in 2022. The Energy Select SPDR-XLE sector fund rose 58%, and Exxon Mobil-XOM rose 88%. The energy outperformance resulted from a decade of underperformance and under investment. The lack of investment resulted after oil fell to $26/barrel in 2016, and this exacerbated the boom-bust cycle. The energy sector had also fallen out of favor as the Environment, Social, and Governance-ESG investment objective avoided “dirty non/green” oil investments. Solar typically does well when oil prices rise, and First Solar-(FSLR) gained 72%.
LOSERS:
The FAANGs (Facebook, Apple, Amazon, Netflix, Google) were multi-year darlings, but they were De-Fanged due to their high valuation and the prospect of slowing growth from a probable recession. Facebook/Meta-META was down -64% and Netflix-NFLX was down -51%. More traditional names held up better with Apple-AAPL down -27% and Microsoft-MSFT down -29%.
The Stay At Home winners tumbled as COVID gradually abated. Peloton-PTON lost -78% as their subscription model for exercise equipment dried up. Zoom-ZM held up much better, with a decline of -19%.
Meme Stocks seemed to defy gravity in 2021, but crashed back to earth in 2022. GameStop-GME, the bricks and mortar game seller, was down -50%%. AMC Entertainment-AMC, the movie theatre chain, was down -85%.
Crypto (additional coverage below) stocks like Bitcoin-BTC-USD also deflated. Bitcoin is down -76% from its Nov 2021 high.
On a regional basis, the Chinese Large Cap ETF-FXI was down -23%.
Long-Maturity Bonds were a train wreck. As interest rates rose, bond prices declined, and this caused the total return for the US Treasury 20+ year index to decline -31%. The unprecedented bond market decline caused diversified 60/40 equity/bond portfolios to experience the worst annual performance since 1937.
Long-Term Bulls and Bears:

The graph above shows Long-Term trends for gains and drawdowns. Although bull markets can run for years, drawdown can sometimes last for years as well. The graph also shows periods of high volatility as evidenced by the precipitous decline and rapid recovery as COVID emerged as a risk. The graph highlights the importance of a long-term horizon.
Inflation:

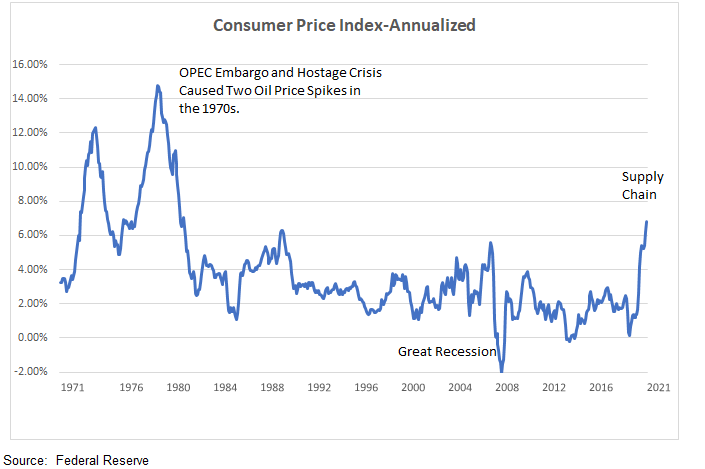
Inflation was the big story for 2022, and the market reacted strongly to any comments about inflation coming from Fed chair Jerome Powell. Initially, Powell described inflation as transitory, but it quickly became clear that this was not the case. Inflation had been relatively stable near the Fed’s 2.0% target for a number of years, leading to complacency about potential increases. However, the annualized Consumer Price Index inflation rate rose from 1.4% at the end of 2020 to 7.0% by the end of 2021, and then to a peak at 9.1% in June 2022. Although prices for energy, cars, and rent have been trending down recently, wage inflation remains high. The strong job market has kept wages high, and there is the potential for sticky wages, particularly in the service sector, to feed through to persistent inflation. As of now, it is unclear how long it will take for inflation to decline and how low it will go. There is also a question of whether Fed rate increases to combat inflation could potentially trigger a recession.
S&P 500 Large Cap:

The graph above shows S&P 500 performance since the pre-pandemic year-end 2019. After setting an All-Time-High of 4,977 on January 3, the S&P 500 dropped to 3,577 on October 12, a decline of -39%. Performance has rebounded somewhat since October and the S&P 500 total return was down -18% for the year.
Valuation:

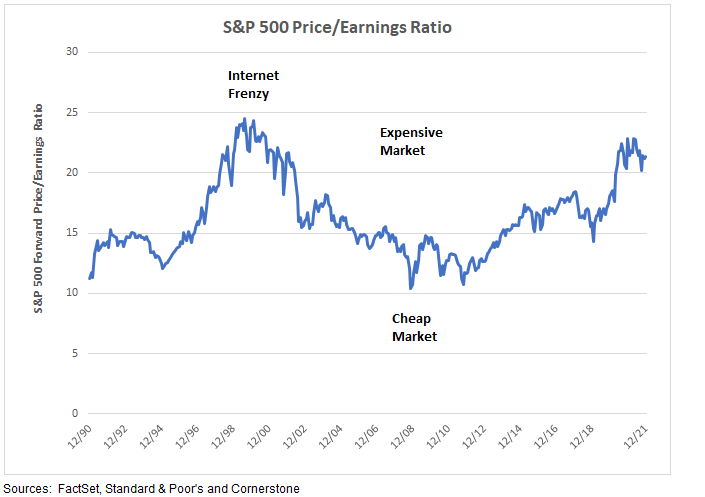
The graph above shows the market’s valuation based on the Price/Earnings ratio for the S&P 500 index since 1990. The market was obviously very expensive in the late 90s during the internet frenzy. The market valuation eventually declined to a very cheap level during the nadir of the 2008 Great Financial Crisis. The current market valuation has fallen as tech and crypto high-fliers declined precipitously. P/E ratios do not provide a good market forecast for near-term performance, and history shows that markets can remain overvalued or undervalued for longer than we like or expect. Nevertheless, PE ratios do provide a good indication of longer-term performance. A relatively high PE ratio indicates below-average investment returns over the next 5-10 years. The current PE is near average historic values, and this implies market performance in line with long-term historic levels.
The graph above shows the market’s valuation based on the Price/Earnings ratio for the S&P 500 index since 1990. The market was obviously very expensive in the late 90s during the internet frenzy. The market valuation eventually declined to a very cheap level during the nadir of the 2008 Great Financial Crisis. The current market valuation has fallen as tech and crypto high-fliers declined precipitously. P/E ratios do not provide a good market forecast for near-term performance, and history shows that markets can remain overvalued or undervalued for longer than we like or expect. Nevertheless, PE ratios do provide a good indication of longer-term performance. A relatively high PE ratio indicates below-average investment returns over the next 5-10 years. The current PE is near average historic values, and this implies market performance in line with long-term historic levels.
Market Consensus Outlook for 2023:

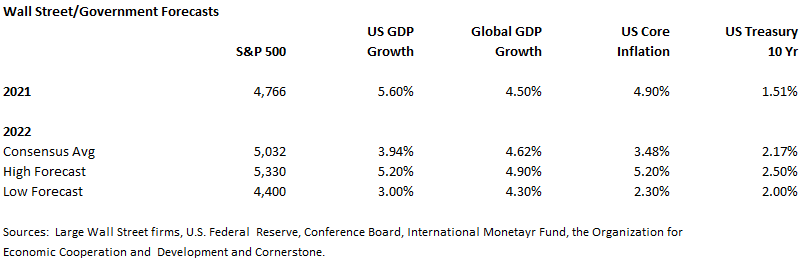
The table shown above highlights consensus year-end 2023 forecasts compiled from Wall Street strategists and from various government entities. FactSet has reviewed strategist accuracy for the 20-year time period from 2002 through 2021 and found the average forecast error was 8.3%. However, when they excluded volatile years of 2002 and 2008, the average error was 0.8%. This indicates that the strategist forecasts are valuable most years, but it also indicates that an investor must be prepared for outlier years.
Although forecasts are sometimes wide of the mark, the consensus data does reflect what is currently priced in the market, and it is a helpful starting point for discerning the fundamental drivers of the markets. An understanding of the consensus expectation also provides perspective as markets react to unanticipated or surprise developments. It is notable that the range between the high and low S&P 500 forecasts are particularly wide, and this indicates heightened risk, uncertainty and volatility.
Small Cap Stocks:

Small cap stocks have outperformed large cap stocks historically, but they have been laggards in recent years. Although small caps are more volatile, they are important in a portfolio’s overall asset allocation plan. Small caps are expected to grow faster than large cap stocks and should provide better longer-term performance. Small caps have been under-owned and should benefit from increased investor interest.
Foreign Stocks:
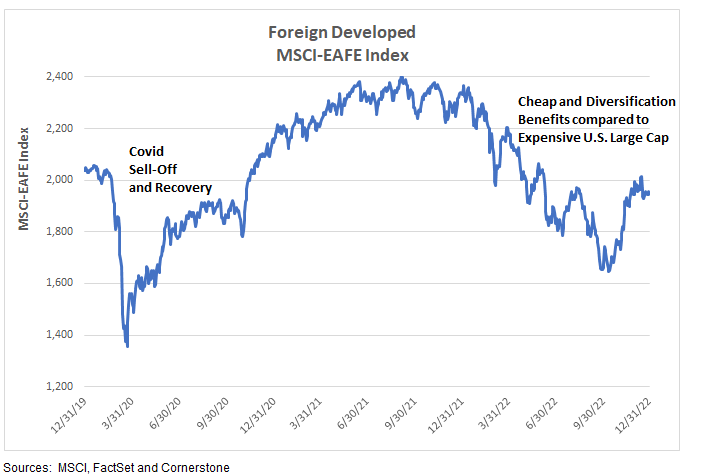
International stocks as measured by the MSCI-EAFE index outperformed in the 1970s, the 1980s, the 2000s and in 2022, but have mostly trailed the S&P 500 since the 2008/2009 Great Recession. International stocks are cheaper than U.S. stocks, and especially cheaper than U.S. large cap stocks, and they should benefit from investors seeking cheaper valuation levels. They also provide additional diversification benefits.
Emerging Market Stocks:

Emerging market stocks are another asset class that has trailed in recent years. Since emerging markets have been a laggard for a number of years, it is easy to ignore them in portfolios. Nevertheless, it is worth remembering that during the “Lost Decade,” the S&P 500 had a -0.95% annualized loss over 10 years (2000-2009). During that same time period, the MSCI Emerging Markets index posted a 10.63% annualized gain! Emerging market stocks are more volatile but offer better growth prospects than developed markets based on a younger population and a growing middle class. They are cheaper than developed markets, they offer diversification benefits and they look poised for good longer-term performance.
BONDS:
Historic Interest Rates:

As depicted in the graph above, the U.S. Treasury 10-year bond yield peaked at 15.8% in September 1981 as the U.S. battled double-digit inflation. As inflation subsided, rates have trended lower. Interestingly, forecasters, including the US Federal Reserve, have consistently projected rising rates. Historic long-term bond total return performance has been positive until 2021 due to bond price increases as rates declined. Rates eventually reached an all-time low yield of 0.52% on 3/9/20 as initial COVID fears caused a flight to quality. Since that time, rates have moved up and performance has been negative.
Interest Rates Since the Pandemic:

Although interest rates declined for nearly 40 years, the recent bout of inflation has caused the Fed to react by raising short-maturity rates by 4.25% in 2022. The year began with the U.S. Treasury 10-year bond yield at 1.51%. Rates then moved up to a 4.24% yield by October 24 due to inflation fears. Since then, longer-maturity rates have come down to a year-end yield of 3.88% due to a moderation in inflation and recession fears. The rising rates have caused the UST 20 year + index to fall by an incredible -31%. Although 2022 was the worst bond market ever, interest rates have moved up and future performance should be better.
Crypto Collapse:
Matt “Fortune favors the brave” Damon, Steph Curry, Gisele Bündchen, LeBron James and others pitched cryptocurrency to the public before a massive implosion. Kim Kardashian paid a $1.26 million fine for pumping the unregistered token EthereumMax on Instagram while failing to disclose that she was paid $250,000 for her post. The 2022 Super Bowl was satirically referred to as the “Crypto Bowl” due to numerous cryptocurrency ads, and was reminiscent of the advertising binge during the dot-com bubble of the 1990s.
The crypto exchange FTX (previously one of the biggest crypto exchanges in the world) declared bankruptcy on November 11. After revelations of risky, unethical business practices, there was a surge of customer withdrawals. Meanwhile, FTX had loaned out customer funds and then didn’t have sufficient funds to cover the customer withdrawals. Sam Bankman-Fried, FTX CEO and founder (and so-called wunderkind), is now charged with eight counts of fraud of “epic proportions.” He is under house arrest and fitted with a bracelet that monitors his movements. Unfortunately, investors using the FTX exchange will face a challenging legal battle in attempting to get their crypto deposits back because the bankruptcy process will likely treat their deposits as uncollateralized, unsecured claims. FTX had been trading far above any fundamental value, so the precipitous decline was no surprise. Bitcoin, the largest blockchain-based digital asset traded on crypto exchanges, dropped from an all-time high of $68,991 in November 2021 to under $17,000 after the bankruptcy announcement. Ironically, the NBA’s Miami Heat are playing in the recently renamed FTX Arena. They are not alone, as the LA Lakers play in the Crypto.com Arena.
The FTX bankruptcy does not appear to pose systemic risk to the traditional financial system like the so-called “Lehman” moment that helped precipitate the 2008 Great Financial Crisis. This experience clearly highlights the value of established exchanges like the New York Stock Exchange and the regulatory infrastructure protecting investors.
It still looks too early to invest in cryptocurrency. Although there were nearly 1,500 IPOs in the late 90s, only a handful are still in business. Very few investors were savvy or lucky enough to invest in Amazon’s IPO back in the day, and picking a big crypto winner today faces long odds. Cryptocurrency and blockchain technology have disruptive and transformative potential, but caution still looks warranted for 2023.
Looking to 2023:
2022 is one for the record books, and it is good to have the year in the rearview mirror. While investment performance was mostly either bad or very bad, it is important to look forward to 2023. For most investors with a long-term investment horizon, the future likely offers better potential, especially for bonds and diversified portfolios. Listed below are various positive and negative investment factors and analysis related to expected future returns.
Positive Factors:
-The sharp market decline means that stock valuations are now in line with historic levels. The silver lining for bonds is that bond price losses have resulted in higher yields and the prospect for positive future returns.
-Household debt levels are in good shape. The household debt-service ratio is lower than at any time prior to the pandemic and cash represents about 25% of total household debt—the highest level since 1970.
-American consumers are flush with more than $1 trillion of stimulus-derived savings and the lowest household debt relative to gross domestic product in two decades.
-U.S. corporate balance sheets are strong with U.S. corporate debt to after-tax profits as low today as it was in the 1960s.
-Employment is strong but it is a conundrum. Although a number of economic recession indicators point to recession later in in 2023, the employment situation remains positive. Typically, the employment conditions deteriorate along with the decline in other economic statistics. There can be a lag, however, between economic deterioration and rising unemployment so employment conditions may eventually fall as well.
–Corporate earnings surprised to the upside during 2021 and 2022. Despite recession fears, earnings reported by FactSet increased at a respectable 5.1% in 2022 and revenue growth increased 10.4%. Earnings growth is seen at 6.4% for 2023 and revenue is expected to grow 4.3%. There is no doubt that current conditions are clearly being impacted by the economic slowdown. If inflation remains higher than expected, then broad-based consensus earnings growth could be revised downward.
-The US economy doesn’t appear to have overbuilt inventories or other excesses.
-China is easing their zero-COVID policy controls, and they have announced an end of quarantine requirements for inbound travelers. The gradual reopening of their economy bodes well for future global economic growth.
Negative Factors:
-Inflation may prove more persistent than the market currently expects, and this could cause the Fed to raise rates higher than currently expected and this could also precipitate a deeper, longer recession. A December Bloomberg survey of economists currently indicates a 70% chance recession in 2023, and the current bear market may well be associated with an upcoming recession. There have been 17 bear markets since World War II and the average decline has been -31%. Of the 17 bear markets, 9 were accompanied by a recession, and the average recessionary market decline was -36%. Recessions typically see 10-20% earnings decline. Finally, the Fed’s desired “soft landing” (curbing inflation without sinking the economy) is hard to achieve and historically improbable.
-Traditional recession indicators point to a recession, especially the “inverted yield curve.” The bond market moved into an inverted yield curve position in July as short-term Treasury interest rates rose to 2.89%, above the longer-maturity 2.67% U.S. 10-year Treasury Note interest rate. This inversion of the maturity timeline resulted from the Federal Reserve pushing up short-term interest rates to control inflation while the broader bond market, fearing a recession, pulled down long-term interest rates. (The yield curve typically has an upward slope with lower short-term rates and higher long rates as investors require a higher rate to compensate for the longer maturity commitment and unanticipated inflation.) An inverted yield curve preceded the last seven recessions. As a result, there is heightened concern about a looming recession.
-Although there are numerous recessionary indicators, the market assumes either a soft landing with slow but positive growth, or a short, shallow recession. This optimistic assessment is driven by a solid job market. History shows, however, that inflation is slow to be eradicated.
-After decades of globalization, the norm is now deglobalization as companies seek to insource operations and shorten supply chains. The net effect is slower economic growth due to less efficiency and lower productivity.
-Decarbonization is now a reality as numerous studies point to the prospect of a future tipping point where there is an irreversible change in the climate system and locking in further global warming. As a result, there is a necessity for new “cleaner” infrastructure investment, and the reality of higher operating costs.
-Demographic shifts are resulting in an aging population and labor shortages that results in slower growth in developed economies.
-Political developments continue to be a risk. The Russia/Ukraine war not foreseen last year, but it continues to be a drag on global economic growth. Iran is unstable with riots. China’s tensions with Taiwan and Hong Kong are troubling. North Korea is another threat. Political events or changes in government policy are often discounted, but they do happen and they negatively impact growth prospects.
-Massive stimulus packages implemented in 2020 and 2021 to battle COVID are now mostly expired. Consequently, this component of growth is no longer an economic driver. Meanwhile, there is an argument that the stimulus may have not delivered the kind of longer-term potential growth that many economists expected.
– Stagflation is a key risk facing the global economy as growth continues to slow while inflation remains stubbornly elevated.
What should you expect in the future?
It is very difficult to accurately predict market performance for the upcoming year, but bond market performance looks positioned to produce positive performance. History suggests that equity markets will also rebound, and a diversified portfolio will do much better in the coming year. Longer-term trends are more important for financial health than annual performance and there are industry guidelines to inform your longer-term planning timeline. Short-term volatility in both directions often leads to poor investment decisions. During the internet frenzy of the late 90s, it was common to extrapolate huge returns into the future. Despite these lofty aspirations, it was actually a time when we were heading into a lost decade. By contrast, the Great Financial Crisis in 2008 caused many to assume the worst and go to cash. In reality, the ensuing decade generated stellar returns. Neither of these highly volatile short-term situations were realistic or helpful for future performance.
At this stage in the investment cycle, pessimism is probably the biggest risk for most investors. It is easy to talk about discipline and a long-term perspective, but it is not easy to implement in either up or down markets. At the beginning of 2022, some pundits said we are in the midst of the “Roaring 20s”, and others warned of another “Lost Decade.” The reality is that no one knows for sure, but it is best to position portfolios within a longer-term perspective.
-For shorter timelines, it is best to stay conservative and avoid risk.
-For longer timelines, it is helpful to consider expected long-term returns.
Listed below are expected returns for major asset classes:

These long-term asset class returns are compiled by Cornerstone from major asset managers like JP Morgan, Vanguard and others.
It should be noted that these returns are higher than last year due to the fact that the market is much lower, valuations are much cheaper and bond yields are much higher.
After considering the asset class expected long-term performance above, it is helpful to compile these returns into broad-based portfolios based on your overall Investment Objective.
These long-term returns for Investment Objectives ranging from aggressive to conservative are compiled by Cornerstone from major asset managers like JP Morgan, Vanguard and others.

The table above provides guidance for various Investment Objectives related to longer-term performance expectations. The table allows you to use your personal Investment Objective to show the expected return and risk for your planning purposes for your portfolio.
It needs to said that market knowledge, discipline and experience all help maintain perspective. It also helps to keep in mind that markets can move farther and longer then expected in both directions. Big portfolio winners are likely overweight and expensive, and should be trimmed. Portfolio losers are likely underweight and consideration should be given to purchases. As always, a long-term perspective, appropriate Investment Objectives, diversification and rebalancing are more important than chasing last year’s high-flyers.
Cornerstone exists to provide educational investment information with a Christian perspective. Some posts are purely about investments (like this one), but other posts have covered stewardship and charitable giving, core values and ESG, Happiness/Money, etc. This is a unique combination, and Cornerstone continues to evolve. Your comments are always helpful and are appreciated.
For additional investment and financial planning information see my Cornerstone website http://CornerstoneInvestmentsLLC.com
The information provided is for informational and educational purposes and it does not constitute personal investment recommendations or investment advice. Past performance does not guarantee future performance.
Jeff Johnson, CFA
January 2, 2023