It’s been another eventful year dominated by several key factors.
AI-Spending and Applications have been hot again in 2025, but is it a Bubble?
Crypto performance was down, but there is much discussion about Stablecoins and tokenization. See More:
The economy remained resilient but is now being described as K-Shaped as affordability concerns
with inflation and employment impact middle and lower-income workers.
Markets were strong and gold and international stocks and bonds were surprise winners. Valuation levels remain high and represent a headwind for future performance. Wall Street remains optimistic for a fourth year of positive equity performance.
Charitable Giving: The U.S. remains a wealthy country, and charitable giving provides a Win-Win for both givers and recipients. It is interesting to review economic research related to Faith Factors and the Halo Effect from charitable giving.
AI: Transformational Technology or Bubble?
Artificial intelligence (AI) is everywhere in the investment community. So is the debate. Is AI a once-in-a-generation, transformational super-cycle—or is it evolving to a speculative bubble? Has fear of missing out replaced fear of losing money? Is hype running ahead of reality? And will AI fatigue eventually set in? Bubble talk is no longer fringe—it’s mainstream.
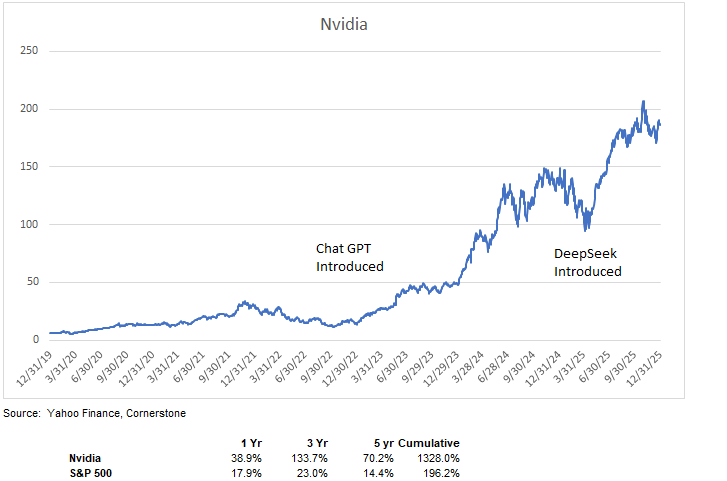
Nvidia with its graphics processing units (GPUs) and system-level support, remains the poster child for the AI revolution.
-Nvidia has delivered a 70.2% annualized return over the past five years, compared with a still robust 14.4% for the S&P 500.
-The stock’s major uptrend began with the release of OpenAI’s ChatGPT, which captured investor imagination and brought AI into the mainstream.
-Nvidia’s 2025 price decline followed the January 2025 release of China’s DeepSeek chatbot, which demonstrated AI capabilities using far less computing power.
-Despite Nvidia’s impressive run, its 2025 39% gain lagged: Broadcom: +51%, Alphabet: +64%, AMD: +78%, Micron Technology: +239% and SanDisk: +577% (leading the S&P 500).
In addition to the stocks listed above, the “Magnificent 7” (Alphabet, Nvidia, Microsoft, Meta, Apple, Tesla, Amazon) have significantly outperformed the broader market over recent years, and with good justification. According to FactSet, Mag 7 earnings grew 26.4% annually since 2020, versus 8.4% for the other 493 S&P 500 companies. As a result, the Mag 7 grew to be 34% of the S&P 500’s total market capitalization and raised a basic question: concentration risk.
What Do We Mean by “AI”?
The term AI is often used casually—and sometimes inaccurately. Talking about AI adds cachet, but clarity matters. At its core, AI is an umbrella term with several defining attributes:
-Large Language Models (LLMs): Trained on vast amounts of text to understand and generate human-like language.
-Pattern Recognition: Learns from data to recognize patterns and make decisions.
-Natural Language Processing: Uses everyday language rather than traditional programming code.
-Machine Learning: Models improve over time by updating themselves based on new data without the need for additional programming.
-Generative AI: Creates original content (text, images, music) using learned statistical patterns—not step-by-step instructions.
-Agentic AI: Systems that can autonomously make decisions, take actions, and adapt to changing environments.
-Current leading chatbot platforms include ChatGPT, Microsoft Copilot, Google Gemini, Claude, Perplexity and Grok.
AI Upside: Commercial and Personal Applications:
Commercial Applications examples:
-Software code generation that displaces less experienced software engineers.
-Customer service automation.
-Drug discovery and clinical development.
-Marketing and advertising.
-Investment and financial analysis.
-Computer vision.
-Robotics and control systems.
-Humanoid robotics.
Personal Applications
Often described as “digital Swiss Army knives”:
-AI-powered search and answer engines.
-Summaries of emails, meetings, and documents.
-Travel planning.
-Writing and editing assistance.
-Spam filtering.
-Voice-to-text,
-Photo recognition.
-Recommendation systems.
-Navigation and traffic prediction.
Bottom line: AI is already being used and there is clear visibility to future utilization and the prospect to disrupt entire value chains. Many believe we are still in the early innings.
AI Challenges and Risks:
Capital Spending is huge, but revenue and profitability are yet to be determined. AI enthusiasm has triggered a massive infrastructure spending binge:
-Big Tech is expected to spend nearly $3 trillion on AI through 2028, but they will only generate enough cash to cover half that tab, according to analysts at Morgan Stanley.
-Chip depreciation may accelerate as hardware cycles shorten.
-OpenAI reported $5 billion in losses in 2024 on $3.7 billion of revenue, with projected cash burn of $115 billion through 2029. Meanwhile, only ~5% of ChatGPT users pay for subscriptions. There is no guarantee that future hoped-for profits will justify the investment.
-Circular financing (where Nvidia lends to a customer) raises questions about actual end-user demand.
Infrastructure Constraints:
-Electricity generation may be insufficient to meet projected demand.
-Permitting delays, grid connections, and local politics remain major bottlenecks.
-Debt financing is increasing (e.g., Oracle funding AI infrastructure for OpenAI).
Employment Disruption:
AI raises profound questions about work and job security.
-Ford CEO Jim Farley recently said AI could replace “half of all white-collar workers.”
-Layoffs across major corporations have heightened anxiety.
-A common refrain: AI won’t take your job—but someone using AI might.
Adaptability, learning, and critical thinking are becoming essential.
Misinformation and Security Risks:
-Hallucinations describe things that don’t actually exist and remain a challenge.
-Risks include bias, privacy invasion, surveillance, cybersecurity threats, and phishing.
Productivity: Promise vs Reality:
There is broad agreement on AI’s productivity potential—but disagreement on timing.
-MIT (Aug 2025): Only 5% of AI pilot programs show rapid revenue impact; most stall.
-Robert Solow’s Productivity Paradox reminds us that productivity often lags technological adoption.
-MIT Sloan research shows short-term productivity declines before long-term gains.
-Wharton/Budget Model projects AI could raise GDP by: ~1.5% by 2035, ~3% by 2055, ~3.7% by 2075
-Early studies suggest task-level productivity gains of 5–25%, depending on role and implementation.
Existential Risks: AGI and Superintelligence:
-AGI (Artificial General Intelligence): AI capable of performing any cognitive task a human can.
-ASI (Artificial Superintelligence): AI surpassing human intelligence across all domains. Superintelligence is regarded by some as the major existential risk.
Current models outperform humans in narrow tasks but lack true general intelligence. The phrase trust, but verify still applies.
Bubble? History Offers Perspective:
Wall Street is debating whether AI represents a transformative boom, or a bubble fueled by extreme valuations and infrastructure overbuilding.
History is littered with similar episodes:
-Steam engines and Railroads.
-Electrification.
-Radio: RCA-Radio Corp of America was the hot tech stock of 1the 920s.
-Nifty Fifty of the 1970s.
-The dot-com boom of the late 90s.
-Housing of the 2000s.
-Fracking of the 2010s.
Bubbles are easy to identify in hindsight and notoriously difficult to time.
Lessons from the Dot-Com Era
-Nasdaq rose 5× from 1995 to March 2000, then fell 78%.
-Many companies failed; a few survivors (Amazon, Nvidia, eBay) endured.
-Nasdaq Price/Earnings ratio peaked above 100× forward earnings.
-Cisco’s P/E hit 130×, despite being a dominant, profitable company.
The Globe.Com Example-A Quick Lesson in Greed and Fear:
The hottest crash-and-burn stock was The Globe.com, somewhat of a precursor to Facebook. The company had little revenue and was not profitable. The IPO in November 1998 was priced at $9.00 and it shot up to $97 on the first day of trading. The company never generated a profit and eventually shut down by August 2001.
Cisco Example:
While many new internet companies had minimal/no earnings, even dominant companies crashed. For example, Cisco, once the largest market cap company in the world built world-class routers for the internet, and was dominant in the market.
-The stock traded at $9.29 year-end 1997,
-Its stock peak at 80.06 on March 26, 2000. At its peak the forward 12-momth Price/Earnings ratio hit 130 according to the Wall Street Journal.
-John Chambers, CEO, in August of 2000, said the second Industrial Revolution is just beginning.
-Then it crashed to $6.66 by October 7, 2002.
Cisco has remained a solid, profitable company but unrealistic expectations drove the stock price far above reality.
Cisco shares have finally recovered from the dot-com bust, closing at $80.25 per share on December 10, 2025, over 25 years after its previous record high in March, 2000.
Today:
-Nasdaq trades around 27–28× forward earnings.
-Nvidia’s P/E is roughly 40×, far below Cisco’s valuation.
-Valuations are elevated—but far below dot-com extremes.
Is It Different This Time?
Arguments for:
-Today’s leaders are profitable, diversified, and cash-rich
-Hyperscalers are not one-product companies
Arguments against:
-Capital intensity is enormous
-Debt financing is rising
-Profit timelines remain uncertain
AI may not crash—but it could underperform for long periods where prices drift flat to down and are called “dead money.” Historic examples include:
-Japanese real estate from the 1990s to the 2010s.
-Gold post-1980.
-Emerging markets had a massive run in the 2000s, but then underperformed for over a decade.
-Commodities supercycle of the 2000s, but then languished post-2011.
Key Takeaways
-AI has strong long-term potential, but visibility on profits is limited.
-Winners and losers are inevitable.
-Valuations today are elevated—but not dot-com extreme.
-Productivity gains likely take longer than markets expect.
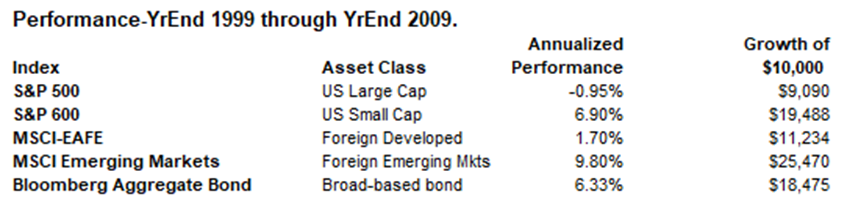
-Diversification is critical. The S&P 500 has been a dominant performer for over a decade, but after the dot-com meltdown it had negative performance for 10 years. It was referred to as the “Lost Decade” and no one wanted to own it. Meanwhile, other asset classes performed much better as shown below:
Base Case:
-AI is short-term overrated, long-term underrated.
-Progress will be uneven, with volatility and setbacks.
-Market leadership will likely rotate away from the Mag 7.
-Large, profitable AI companies today are stronger than the internet darlings of the late 90s and are less likely to implode.
-Smaller AI companies are much more susceptible to a crash.
-Rebalancing and diversification matter more than prediction.
-Saying “this time is different” remains dangerous.
Markets are poor at predicting structural change. History favors diversification, patience, and humility over precise timing.
Crypto Definition, Tokenization, Stablecoins
Like artificial intelligence, cryptocurrency remains a highly visible and widely discussed area for investors. Unlike AI, however, crypto posted negative performance in 2025. Some observers argue that crypto may be further along the hype cycle than AI. At the start of 2025, expectations were high. Legislative and regulatory support—backed by the White House—appeared to signal a favorable environment for digital assets, helping push prices to new highs. Instead, volatility dominated the year.
Crypto Market Performance in 2025:

Bitcoin, the most visible cryptocurrency, experienced sharp swings:
-Fell -18.4% to a 2025 low of $76,272 on April 8.
-Then surged more than 65%, reaching an intraday high of $126,198 on October 6.
-Fell -30.6% from the high to finish the year at $87,508.83, down -6.3% for the year overall.
Margin calls and exchange-traded fund (ETF) flows amplified volatility.
Despite these declines, recent performance pales in comparison to the “crypto winter” of 2022 and mid-2023, when a series of failures—including the collapse of FTX—led Bitcoin to lose nearly 80% of its value.
What Is Cryptocurrency?
Although “cryptocurrency” and “Bitcoin” are widely used terms, many lack a clear understanding of what they actually represent. Despite being depicted as a physical coin, Bitcoin has no physical existence. It can be described somewhat simplistically as code residing on thousands of nodes on independent computers and data center servers distributed across the globe.
A Working Definition:
Cryptocurrency (including Bitcoin, Ethereum, Solana, Litecoin, XRP, and others) is a form of digital money that is created, transferred, and secured using cryptography—encryption mathematics that ensures only authorized parties can transact or verify ownership.
Cryptocurrencies operate on decentralized networks of thousands of independent nodes running on:
-Cloud platforms such as Google Cloud and Amazon Web Services (AWS)
-Large private or corporate data centers
-In some cases, blockchain-enabled home computers
This distributed structure operates in sharp contrast to centralized proprietary systems used by banks or brokerage firms.
Blockchain and Ownership:
At its essence, a Bitcoin, or any other cryptocurrency, is a ledger entry authorized by the user and then replicated on nodes on computers and servers using a blockchain technology.
-A blockchain node functions in a blockchain network by storing the ledger, enforcing the rules, validating transactions, and sharing data with other nodes.
-Blockchain is a specific type of distributed ledger that stores data in linked blocks and makes entries secure, transparent, and tamper‑resistant.
-The ledger entry includes transaction history, spent inputs, an unspent “balances”, transaction fees and other encrypted identifiers.
-You access this ledger using a private key by using your crypto wallet.
Crypto Wallets and Private Keys:
Crypto wallets are accounts that store the keys you need to access and use your cryptocurrency holdings.
Because it is a distributed blockchain ledger, the computers and servers hold identical copies of the ledger, rather than in one central place.
Private key control is somewhat comparable to a password, but more accurately, it is a piece of cryptographic data that mathematically proves ownership of a blockchain address.
It doesn’t reside on a central platform and can not be changed or recovered, so if you lose the private key, then the assets are permanently inaccessible.
How Blockchains stay in Sync:
Every blockchain (Bitcoin, Ethereum, Solana, etc.) stays in sync because each node runs a standardized piece of software that connects to the peer-to-peer network, it downloads and verifies new blocks, stores the blockchain database, and communicates to other nodes. This is why thousands of nodes—whether in data centers, cloud servers, or home PCs—stay in sync, they all use the same protocol through the same client software.
How Investors Hold Crypto:
Cryptocurrency purchases can be made either by setting up your own “wallet”, by purchasing it on an exchange (like Coinbase), or using a traditional broker like Schwab or Fidelity who holds your crypto on your behalf. A wallet requires the most technical knowledge, it requires the user to secure the private keys, and it has no built-in account or tax reporting, but it does provide full control over transfers and transactions. An exchange holds your crypto in custody, it is easier to use, and it provides account information and tax forms. A crypto ETF at a broker provides a full range of services similar to traditional stock purchases. So, holding crypto directly provides the most autonomy and control, but it is essential to maintain a record of your private key.
The cryptocurrency definition above hopefully provides an overview of this new alternative to the traditional financial system. There are many factors:
Background/Overview:
Decentralized Finance:
Bitcoin was created as a decentralized financial system operating on a blockchain platform as an alternative to traditional financial systems reliant on intermediaries like banks, brokerages, or exchanges. Bitcoin’s blockchain technology enabled peer-to-peer transactions without oversight or control from financial institutions, governments, or sovereign authorities. This alternative payment infrastructure aimed to provide greater financial autonomy, free from government surveillance and intervention.
Transactions and a Store of Value:
In addition to autonomy and privacy, Transaction processing and a store of value were seen as key benefits. Bitcoin was originally envisioned as a decentralized payment system that would be quicker/cheaper than a bank, but it is now rarely used for traditional day-to-day transactions.
Store of Value:
Instead of transactions, proponents increasingly regard Bitcoin as “digital gold”—a store of monetary value and a hedge against inflation. The store of value rationale is based on concerns over the U.S. Federal debt, which has reached $38 trillion and it continues to escalate at an unsustainable pace. Coupled with monetary and fiscal policy uncertainty and potential long-term inflationary pressures, Bitcoin’s appeal as a store of value becomes more evident. Bitcoin offers scarcity—a key attribute that supports its potential as a hedge against inflation, excessive government spending, and ballooning national debt. Unlike fiat currencies like the U.S. dollar, which governments can print indefinitely, Bitcoin has a finite quantity with 19.9 million “coins” that have currently been created, out of a total of 21 million that will ultimately be created decades from now.
The store of value rationale for holding cryptocurrency has not been very stable thus far. Crypto has been extremely volatile and has tended to go up and down with the equity market, rather than being a counterweight. Bitcoin has been dubbed “millennial gold”, but the 2025 decline of -6.3% stands in sharp contrast to gold which rallied 64%.
Illicit Activity:
At this point in time, cryptocurrency transactions have not become mainstream, but have been associated with criminal activities, including ransomware attacks, money laundering, human sex trafficking, weapons smuggling and other black-market dealings. Countries like Iran and Venezuela use cryptocurrency to bypass the international banking institutions to evade U.S. sanctions.
Energy Consumption is an issue, especially for Bitcoin:
For transactions, Bitcoin uses a Proof of Work process that is extremely energy intensive, massively more than a Visa transaction. Meanwhile, Proof of Stake networks (like Ethereum, Cardano and Solana) are described as using 99.9% less energy.
There is no Intrinsic Value:
The Intrinsic Value of a business or security is based on inherent value based on future cash flow, risk, and growth potential. Intrinsic value reflects worth based on an objective calculation and it may be different from the current market price of an asset. Since Bitcoin and some other crypto players have no cash flow the value is derived for what others perceive the value to be based on supply and demand. Skeptics ask what problem does it solve for our economy? It is noteworthy that crypto has risen in a fairly ebullient bull market. Markets vacillate between overconfidence and panic. Crypto has not been around long enough to experience the part of the market cycle with emotional panic selling. The lack of the safety of tangible cash flows during a market panic could cause the crypto universe to implode.
Speculative Element:
Current market movements in cryptocurrency are heavily driven by sentiment and momentum. Bitcoin and a few other crypto assets have delivered extraordinary performance, but this has come with equally extraordinary volatility.
Non-Fungible Tokens-NFTs:
NFTs are an example of assets residing on the blockchain technology. They are digital certificates of ownership with a unique ID that can’t be faked. Basically anything real or digital can have a corresponding NFT created for it. It’s a unique identifier like a barcode, certifying ownership and authenticity, and it’s recorded on the blockchain, a public permanent digital ledger showing ownership. Common Uses:
-Digital Art: Artists can sell “original” digital paintings.
-Gaming: Owning a unique sword or skin in a video game that you can actually sell to other players.
-Collectibles: Like digital versions of Pokémon cards or NBA highlights.
-Real World: Using them as digital deeds for houses or membership passes to exclusive clubs.
Many NFTs have been highly speculative. At its peak in 2021, the NFT art market was worth $2.9 billion according to the Wall Street Journal. In the first quarter of 2025, it was valued at just $23 million-a 99% crash.
Consumer Protection:
Crypto is not currently afforded SEC consumer protections, and. the rules governing this space have yet to been written. The Genius Act brought some definition to the stable coin industry, but it is not comprehensive. Congress is currently working on the Clarity Act to create a comprehensive cryptocurrency and digital-asset regulatory plan, but it is extremely complex and deals with too many details to adequately address industry complexity and the systemic risks created by cryptocurrencies and stablecoins.
Newer Technology:
Could other coins displace Bitcoin? The cryptocurrency industry is dynamic and continuously evolving. At its core, Bitcoin is a technology product reliant on blockchain technology for its security. However, newer entrants in the space are emerging with protocols that use less energy and process transactions faster, more efficiently, and at lower costs. Although quantum computing has not achieved commercial utilization and applications, quantum computers could conceivably break encryption codes. These advancements could challenge Bitcoin’s dominance.
Government Role:
The U.S. government may create its own form of digital currency, potentially reshaping the landscape of cryptocurrency. With so much technological innovation and regulatory uncertainty, the long-term prospects for Bitcoin and other cryptocurrencies remain difficult to predict.
Stablecoins:
Stablecoins are digital currencies designed to maintain a stable value, typically $1. They aim to reduce volatility and improve usability for transactions.
Key characteristics:
-Typically backed 1:1 by dollars, gold or other reserves
-Operate on blockchains but resemble digital cash
-Common issuers include Tether (USDT) and Circle (USDC)
Stablecoins are sometimes called “shadow money” because they enable rapid cross-border transfers outside traditional banking systems.
Tokens and Tokenization:
A token is a digital record on a blockchain digital ledger. Tokenization refers to the registration of ownership rights to real-world assets—stocks, bonds, money-market funds, gold, or real estate—as blockchain-based tokens.
Tokenization is becoming increasingly common within the financial services industry. Wall Street has moved deeper into tokenization since the passage of the Genius Act in July 2025. The landmark measure established a regulatory framework for tokenizing stablecoins and other assets. Since then, JPMorgan has developed a new tokenized money fund “MONY” that pays interest.
Visa is moving to integrate blockchain and stablecoins into the traditional financial system by offering U.S. banks and fintechs the ability to settle transactions with the company in Circle Internet Group’s USDC stablecoin. Broader availability in the US is planned through 2026.
Tokenization Benefits:
Benefits includes real/near time settlement, lower back-office and capital costs, newer/innovative products and transparency. Many say that most financial transactions will migrate as tokens on the blockchain. If this is the case, then the volume will be potentially many, many orders of magnitude greater than current usage. Moving global financial transactions onto blockchains would create volumes far beyond today’s capacity—but modern blockchains are being designed specifically to handle that scale.
It will take time:
It will take timeif/when the blockchain goes mainstream. It needs regulatory clarity, technology development, and robust transactional capabilities, but if offers a more innovative products and a fundamental basis and benefits than simply owning Bitcoin. It is helpful to remember that the internet started small, but it evolved greatly compared to when it first became common.
Portfolio Considerations:
The Crypto investment rationale can be made for a store of value and as a hedge against market turbulence. For those seeking a hedge against large market downdrafts, a 1-2% allocation is typically recommended. Morningstar has completed analysis of adding cryptocurrency to a traditional portfolio and says that 5% is a critical juncture where the risk profile of the portfolio meaningfully starts to change. Going beyond a 5% allocation is where things can get wild. At 10%, the blended crypto allocation occupies over 50% of the portfolio’s total risk while a 25% weight takes that number up to a whopping 87%. The portfolio with a 25% crypto allocation is also more than twice as volatile as the standard 60/40 portfolio, so investors allocating that much require “nerves of steel”.
To Summarize: The cryptocurrency industry is complex and speculative, it is clearly in the early innings, and it looks like the Wild West.
The utility of artificial intelligence is widely recognized, but opinions on the value of cryptocurrencies remain highly divided.
Bitcoin’s store-of-value thesis is unproven.
-Stablecoins and tokenization offer clearer practical value.
-Blockchain-based finance may evolve gradually, similar to the early internet.
-Fraud, volatility, and regulatory uncertainty remain significant risks.
Institutional involvement suggests maturation of the industry, but history alsoshows Wall Street aggressively selling the internet. Crypto remains a high-risk investment where potential rewards often come with outsized downside. Investors should proceed cautiously and with clear expectations.
U.S. Economy:
The U.S. economy has been a juggernaut in recent years that has defied economists’ pessimism.
The Pandemic Shock and Rapid Recovery:
The 2020 Covid-19 pandemic caused a massive economic shutdown and a recession that began February 2020 and ended April 2020, the shortest, deepest on record. A Bloomberg survey of private forecasts at that time showed an expectation that Q2 GDP would plunge by –30% annualized, with full‑year GDP down –6% to –8%. By years end, however, GDP had only declined -2.1%, and it came back with a rip-roaring 6.2% growth rate in 2021. The rapid recovery was largely driven by unprecedented fiscal and monetary stimulus.
Inflation Shock and Recession Fears:
Although the “COVID recession” was brief, post-pandemic inflation surprised policy makers and many in the market. Inflation, initially described by the Fed as transitory, surged to an 8.0% average in 2021 and it peaked at a 40-year high of 9.1% in June 2022.
By 2022, many economists placed the probability of recession between 50% and 70%. Markets responded violently: equities sold off sharply, and bonds suffered their worst annual performance on record. In hindsight, that period proved to be an attractive buying opportunity. Despite widespread fears of a deep downturn, the U.S. economy ended 2022 with 2.5% GDP growth.
Trade Policy Shocks:
In 2025, markets faced another shock when President Trump announced “Liberation Day” tariffs on April 2, targeting a broad range of imports. Stocks and bonds sold off sharply, and consensus forecasts shifted toward much weaker growth or an outright recession.
-The Wall Street Journal raised its estimated 12-month recession probability to 45%, up from 22% in January.
-Goldman Sachs raised its recession odds, and JPMorgan warned of slowing growth.
However, the most extreme tariffs were later scaled back, markets recovered quickly, and U.S. trading partners responded with minimal retaliation. Once again, the economy defied expectations. Through the first three quarters of the year, real GDP grew 2.1%, with Q3 growth surprising to the upside at a 4.3% annualized rate. The economy benefited from three interest-rate cuts and resilient consumer spending and household balance sheets remain relatively healthy.
Corporate Profits:
Corporate profits have also exceeded expectations, even in the face of tariffs. Since Q1 2023, analysts have consistently underestimated S&P 500 earnings that have been driven by stronger-than-expected revenue growth and sustained profitability. Large-cap companies, in particular, have achieved expanding profit margins. Improving margins have helped fuel a capital expenditure supercycle centered on artificial intelligence. As AI-related investment has surged, non-AI capital spending has grown at low single-digit rates. Companies are betting that AI will deliver meaningful cost savings and productivity gains—an assumption that will ultimately determine whether these investments justify their scale.
Beneath the Surface: A K-Shaped Economy:
Despite strong headline data, economic discontent remains widespread. Consumer spending is holding up, but it is increasingly concentrated among higher-income households. Economists often describe the current environment as a K-shaped economy:
-Upper-income households continue to spend freely.
-Lower- and middle-income households are under pressure and are focusing spending on necessities such as rent, food, and utilities—areas where inflation has hit hardest.
While nominal wages have risen, prices have risen faster. The Consumer Price Index shows that many goods and services now cost roughly 25% more than in 2020. Essentials such as housing, rent, coffee, ground beef, car repairs and insurance, electricity, child care, and medical deductibles and co-pays have all increased markedly this year.
This growing affordability problem, combined with a cooling job market and still-elevated interest rates, has weighed on sentiment. According to the University of Michigan’s monthly survey, consumer sentiment in December fell 29% from 2024 levels. JPMorgan highlighted the unusual nature of the current cycle: “The juxtaposition of an acceleration in business spending alongside a material softening in job growth is unprecedented in the global economy over the past quarter-century. In the U.S., this juxtaposition is not evident in over 60 years of history.”
Looking Ahead:
Near-term economic prospects appear constructive:
-The One Big Beautiful Bill Act should boost household cash flow through larger tax refunds.
-Corporate profitability will benefit from provisions such as immediate deductions for Research and Development spending
-A productivity boost—driven in part by AI adoption—could further support earnings.
-According to FactSet, corporate earnings are expected to grow 15%, supported by 7.2% revenue growth and continued margin expansion.
-The Federal Reserve is also expected to cut interest rates.
Risks and Open Questions:
Several yellow flags remain:
-Inflation appears stuck near 3%, limiting policy flexibility.
-The long-term impact of AI on employment remains uncertain.
-Economic outcomes are likely to include surprises, both positive and negative.
Longer-Term Considerations:
The U.S. economy continues to show remarkable resilience, supported by strong corporate profits, consumer spending, and an accelerating AI investment cycle. Yet beneath the surface, affordability pressures, uneven growth, and structural policy risks suggest that the path forward will remain complex—and far from smooth. Moreover, tariffs and industrial policy introduce economic distortions that undermine comparative advantage. Protectionist policies often favor incumbent industries facing decline or obsolescence, potentially reducing efficiency and long-term growth.
Markets:

Precious Metals Strength:
Markets were particularly strong in 2025, and were led by many that were laggards in the past. Gold was a major surprise, gaining 64% to $4,324/ounce and silver was up 140%. Gold benefitted from Fed Reserve rate cuts, concerns about burgeoning US debt at $38 trillion, safe-haven buying and even consumer demand for gold at Costco. Foreign central banks also increased gold purchases as they diversified away from a weakened U.S. dollar in what is described as a currency debasement trade. With inflation eroding the purchasing power of fiat currencies, gold regained appeal as a store of value.
Silver gained based on strong fundamentals for solar, AI, wireless networks and continuing EV demand.
Historically, such strong gains in gold have often coincided with weak equity markets—making 2025’s simultaneous strength in both metals and stocks particularly notable.
International Equities: Catching Up:
Foreign stocks delivered standout performance:
-Developed international stocks (MSCI EAFE): +31.2%
-Emerging markets: +33.6%
Both benefited from cheaper valuation levels and a weaker U.S. dollar. Emerging markets, in particular, were helped by a catch-up from many years of institutional underweighting. Despite accounting for 51% of global GDP and 85% of the world’s population, emerging markets represented only 24.5% of global market capitalization entering 2025.
Top-performing countries included:
• South Korea: +76%
• South Africa: +64%
U.S. Equities: AI Still Dominates:
U.S. markets continued to be driven by artificial intelligence (and especially semiconductors) with Nvidia up 39% and Micron up an extraordinary 239%. The Nasdaq, with a high weight of AI, gained 20% and the S&P 500 was up 17.9%. Although the “Magnificent 7” has dominated performance in recent years, only two members of the Mag 7—Alphabet and Nvidia—outperformed the S&P 500 in 2025.
Looking to 2026:
It needs to be said that the growing concentration of the Magnificent 7 is notable. In 2015, these companies represented 12% of the S&P 500, but today they account for 34%. While they have driven much of the index’s recent performance, their current weight argues for rebalancing toward smaller-cap U.S. stocks, international equities and bonds.
Bonds:
U.S. bonds delivered strong, broad-based performance in 2025 across most major categories, benefiting from Federal Reserve rate cuts and a resilient economy. The Bloomberg U.S. Aggregate Bond Index: gained 7.3%. The longer maturity U.S. Treasury 20+ Year Index gained4.6%. The Bloomberg High-Yield Corporate Bond Index gained 8.6%, supported by a solid economic backdrop and low default concerns. The strongest performer among major bond categories was the J.P. Morgan Emerging Markets Bond Index with a gain of 13.9%. Strength was driven by a weakening U.S. dollar and attractive yields.
Key Drivers in 2025:
-A Successful “Soft Landing.” Economic resilience allowed the Federal Reserve to cut interest rates without triggering a recession, creating a “Goldilocks” environment for bonds—strong enough to limit defaults, yet cool enough to push yields lower and prices higher.
Interestingly, long-term yields remained elevated due to fiscal concerns and a rising term premium before finally rallying late in the year.
-Credit Strength. Corporate bond spreads tightened to their narrowest levels in 15 years during the third quarter, reflecting strong investor confidence in corporate balance sheets and earnings durability.
Outlook Heading into 2026:
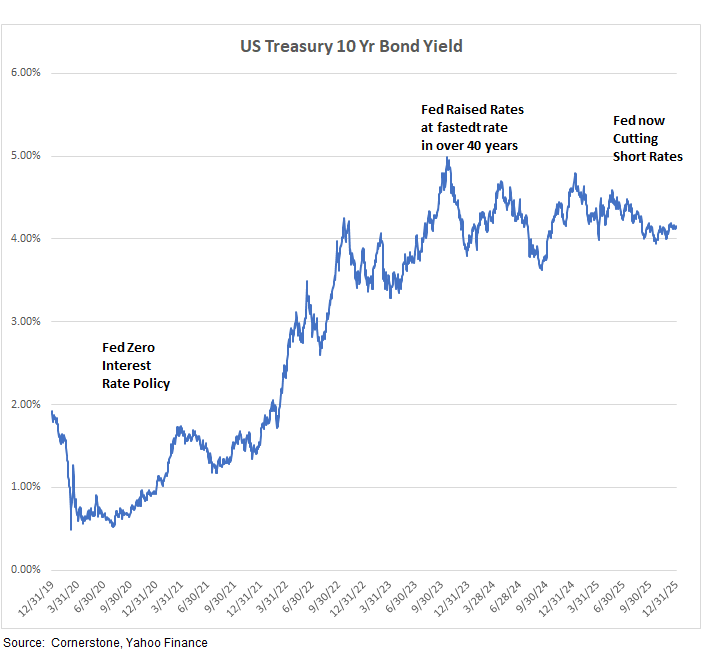
As 2025 came to a close bond yields remain at attractive entry points, with the 10-year U.S. Treasury ending the year near 4.15%. However, analysts caution that with credit spreads already extremely tight, bond returns in 2026 are likely to be driven more by coupon income than by the sizable price appreciation experienced in 2025.
Valuation:

The graph above shows the S&P 500’s valuation over time. It measures the market by aggregating the total market capitalization of all S&P 500 companies and dividing that figure by the index’s aggregate earnings. Based on this approach, the year-end 2025 forward price-to-earnings (P/E) ratio is approximately 22, a level that is expensive relative to historical norms.
It is important to be aware of current valuation levels. From a historical perspective, the 1990–2025 average trailing P/E for the S&P 500 was 19.7 and the average forward P/E over that period was 16.6.
It is sobering to remember that the August 1982 Forward PE was at 5.6. But, it is also important to remember that it was the beginning of a 17-year bull market that ended in early 2000 with the bursting of the dot‑com bubble. The S&P 500 gained nearly 1,400% over that time period.
Market valuation levels are important, but the P/E ratio is not a reliable indicator of short-term market performance. It should not be used in isolation for market timing or trading decisions. Markets can remain overvalued or undervalued for extended periods, sometimes lasting years. Other common valuation metrics—such as price-to-book or price-to-cash-flow—also appear elevated, and there are few obvious bargains offering outsized upside.
What Valuations Do—and Do Not—Tell Us:
While valuation metrics are poor tools for forecasting performance over the next year, they do provide insight into long-term returns. An expensive market may still generate strong returns in the near term, but historically it has tended to produce below-average returns over the following 10 years. Conversely, markets that start from low valuation levels are more likely to deliver above-average returns over a decade.
Importantly, the market has been expensive for several years, but abandoning long-term investment objectives can be a mistake. Moving everything to cash during this period would have meant missing substantial upside.
A Longer-Term Valuation Measure-CAPE:
Most valuation measures focus on recent earnings or forward 12-month expectations. A longer-term perspective is provided by the Shiller Cyclically Adjusted Price-to-Earnings (CAPE) ratio. CAPE uses 10-year, inflation-adjusted earnings, which helps smooth out economic cycles and short-term volatility. Since 1990, the average S&P 500 CAPE ratio has been about 27. Today, CAPE stands near 39, well above its long-term average. Historically, such elevated CAPE levels have been associated with below-average returns over the next decade.
Criticisms of CAPE—and Why They Matter:
The CAPE ratio has its critics.
-Robert Shiller’s data series begins in 1881, when the U.S. economy resembled an emerging market and stock prices were more easily manipulated. Since then, the economy has evolved dramatically:
-A shift from manufacturing to a service- and technology-driven economy
-More asset-light business models and global scale
-Lower corporate tax rates
-A declining share of output going to labor
-Higher profit margins, capital efficiency, and productivity
These structural improvements arguably justify higher valuation levels than historic averages from the past—though not necessarily the current CAPE level of 39.
Key Takeaway for Investors:
Important to remember that the trailing and forward PE ratios for either an index or an individual stock do not have significant predictive value related to total return performance for the upcoming year. Indexes and stocks can remain both over and under-valued for long stretches of time. However, the CAPE does.
Taking a longer-term CAPE perspective/view helps prevent drastic, emotional short-term moves that hurt long-term performance.
Charitable Giving and Philanthropy
Investment returns have been strong both recently and over the longer term, contributing to a surge in U.S. household wealth. According to the U.S. Census Bureau, total household net worth reached $168.8 trillion at the end of 2024. While the top 1% of households held 30.8% of that wealth, median net worth was still a meaningful $193,000. Median family income in 2024 was reported at $106,000. These figures highlight the substantial capacity for charitable giving in the United States—and especially among higher-wealth and income households.
The State of U.S. Philanthropy:
Against the backdrop of wealth, charitable giving in the U.S. has rebounded strongly. The Giving USA 2025 report, produced by the Indiana University Lilly Family School of Philanthropy shows a significant resurgence in generosity during the 2024 calendar year. Supported by stock market gains and a resilient economy, total U.S. charitable giving reached a record $592.5 billion, representing 2.0% of GDP.
Individuals remain the primary source of charitable contributions, providing $392.45 billion, or 66.2% of total giving.
By category, religion remained the largest recipient at $146.54 billion (24.7%), followed by:
-Human Services: $91.15 billion (15.4%)
-Education: $88.32 billion (14.9%)
Long-Term Trends in Religious Giving:
Although religious organizations continue to provide the largest share of charitable dollars, their share has been declining for decades. In 1987, religious giving accounted for 53% of all U.S. philanthropy, but by 2024, that share had fallen to less than one-quarter. This trend reflects broader cultural changes, including the rise of “religiously unaffiliated” adults (now about 26% of the population) and lower rates of regular church attendance.
The Economic Impact of Faith-Based Giving:
Despite this relative decline, religious charitable giving continues to be a powerful force economically and socially. Economists analyze charitable activity through economic multipliers, which measure how spending ripples through local communities. In this context, researchers have identified what is sometimes called the “Faith Factor” or “Halo Effect.”
Research by Brian Grim (Georgetown University and the Religious Freedom & Business Foundation) and Ram Cnaan (University of Pennsylvania) suggests that congregations generate a multiplier of approximately 3.39. In other words, for every $1 a congregation spends, the surrounding community receives more than $3 in economic value.
Their work estimates that religious institutions contribute roughly $1.2 trillion annually to U.S. GDP, acting as an economic “silent partner” in their communities.
Supporting this view, the Pew Research Center, drawing on studies from the Interdisciplinary Journal of Research on Religion, estimates that religion contributes more than $1.1 trillion annually through congregations, faith-based institutions, and religiously affiliated businesses. These contributions include services such as:
-Alcohol recovery programs
-Unemployment assistance
-Disaster relief
-Health care services
-Educational programs
Broader Social Benefits:
Beyond measurable economic effects, charitable and faith-based giving generates significant intangible benefits. Pew Research Center data show that adults who are highly religious—defined as being actively involved and attending services at least monthly—are significantly more likely to volunteer and donate to those in need. Additional benefits such as increased happiness, healthier lifestyles, improved stress management, civic engagement, foreign missions, and international aid are difficult to quantify, but clearly add substantial value to society.
Recommendation:
Cornerstone exists to provide investment insight from a Christian perspective and believes that the level of wealth and income in the United States provides meaningful charitable and philanthropic benefits. This generosity is a Win-Win for both the giver and the recipient and it delivers a true “big bang for the buck”—economically, socially, and spiritually.
Outlook
Analyst 2026 Outlooks:
The stock market, as measured by the large cap S&P 500 has just completed it’s third year of double-digit gains, and most strategists see another strong year for 2026. According to the CNBC strategist compilation, the S&P 500 Year-End close, the consensus target is 7,555, up 10.4%. The outlook for the U.S. 10-Year Treasury Yield Forecast (End of 2026) ranges from 4.1% to 5.0%.
The consensus for the Core CPI (excluding food & energy) is 2.8%, roughly in line with the current level.
Consensus outlooks are not predictions so much as aggregated expectations that show what is currently priced into the market. Corporate earnings forecasts embedded in these outlooks are more accurate than the overall ending market values, and these earnings forecasts help establish a fundamental basis for various asset classes. These outlooks also help determine reactions to new developments, set benchmarks for performance, inform risk management, shape narratives in financial media and policymaking.
Long-Term Expected Returns:
While short-term projections for 2026 are useful for understanding current consensus pricing, long-term projections are more relevant for strategic planning, such as retirement planning. Market outlooks often focus on near-term factors affecting the upcoming year, but it is crucial to consider longer-term growth drivers and risks. On the positive side, long-term trends, driven by human ingenuity and creativity, are likely to continue improving productivity and leading to new products. Additionally, people are living longer, healthier, and more productive lives, and innovations like artificial intelligence are expected to further boost productivity.
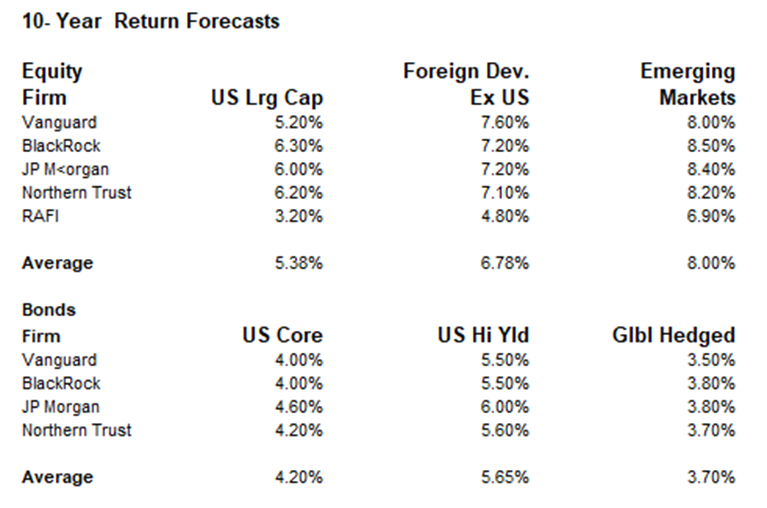
These outlooks show 10-year expected returns that are lower than historic levels, and this is consistent with high current CAPE valuation levels as discussed above. There is no assurance that 10-year returns will match the expected returns listed above, it does provide a useful basis for planning purposes.
WrapUp
Artificial intelligence was a major driver of market performance in 2025, supported by a resilient U.S. economy and strong corporate earnings. While optimists foresee continued growth, skeptics caution against speculative excess. The long-term fundamental case for AI remains strong, and exposure to this category is expected to deliver positive long-term results.
The near-term performance may be volatile, and a large overweight in a few highly-visible stocks could negatively impact performance. It is important to keep in mind that the S&P 500 has 34% exposure to the Mag 7. This offers significant AI exposure and it also causes a concentration risk if these stocks underperform. As a result, it is essential to stay diversified and to include small caps, developed international, emerging markets and bonds.
A review of past market bubbles suggests a base case that does not involve a broad, precipitous market collapse. Many AI-related companies are profitable, well-capitalized, and diversified. While some may underperform in the future, they are not expected to implode. Among more speculative names, however, outcomes are likely to range widely, with both significant winners and losers. In addition to the base case, there is a lower-probability scenario where AI-enhanced productivity gains provide for stronger markets. There is also a lower-probability scenario where performance is similar to the post-internet decade where the S&P 500 generated negative returns in what is called the “Lost Decade”.
The outlook for cryptocurrency is more speculative and is still in the early innings. For those concerned about a broad, sustained market decline, A 1–2% allocation to cryptocurrency might serve as a hedge in case of market disruptions or as a potential bet on the displacement of legacy financial systems. Larger allocations dramatically change the return/risk profile. Cryptocurrencies have existed in an optimistic long-term bull market, but it is difficult to know how crypto will react to panic-induced selling as the market cycle eventually moves to a downward phase.
As always, history reminds us that past performance does not guarantee future results.
Long-Term Themes:
Economic growth is cyclical, but markets have benefited from the positive long-term economic growth. There are unknown factors and there will be surprises, but it is critical to maintain focus on long-term growth.
Staying invested with an asset allocation mix that is consistent with your long-term risk/reward profile continues to offer the best way to achieving your objectives.
It is important to remember the lessons from past market excesses:
Diversification: As always, diversification remains critical. It’s not rocket science—avoiding over-concentration simply reduces risk.
Rebalancing: Strong performance in specific sectors, like AI, has caused many portfolios to become highly concentrated. Regular rebalancing ensures alignment with your target asset allocation and investment objectives.
Long-Term Focus: Time in the market consistently proves more impactful than trying to time the market. Sentiment and speculation are short-term factors that hinder performance.
Jeff Johnson, CFA
January 8, 2026
